This article is about how to use trace function in TIA PORTAL.
You can find trace function in CPU-1200 and CPU-1500 models of Siemens PLC.
With this trace feature, you can configure specific data that you want to trace and record when the CPU meets a trigger condition that you define. The CPU stores the recorded data, and STEP 7 provides tools for retrieving and analyzing the recorded data.
So the traces function is used to track or record the Input or Output at the required condition. You can simply have to add Input or Output to the list and you can record the value and check the functionality of your processes within TIA PORTAL.
Trace Function
Follow the below steps to learn how to add Inputs or outputs to record the value.
Step 1:
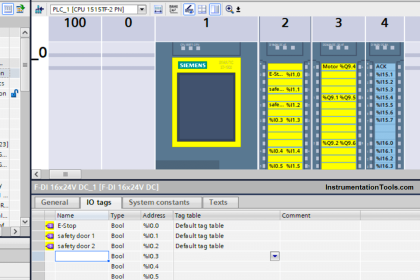
Open TIA PORTAL. Create a new project and select CPU-1200 or CPU-1500.
Step 2:
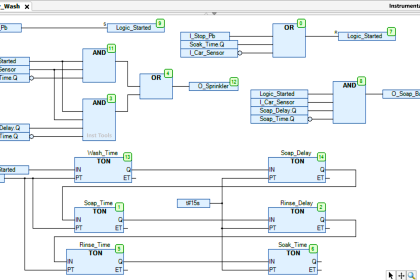
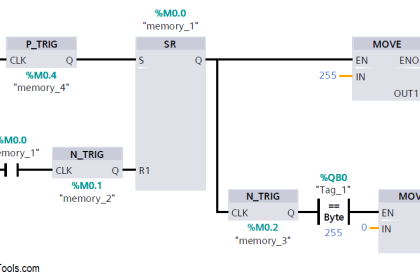
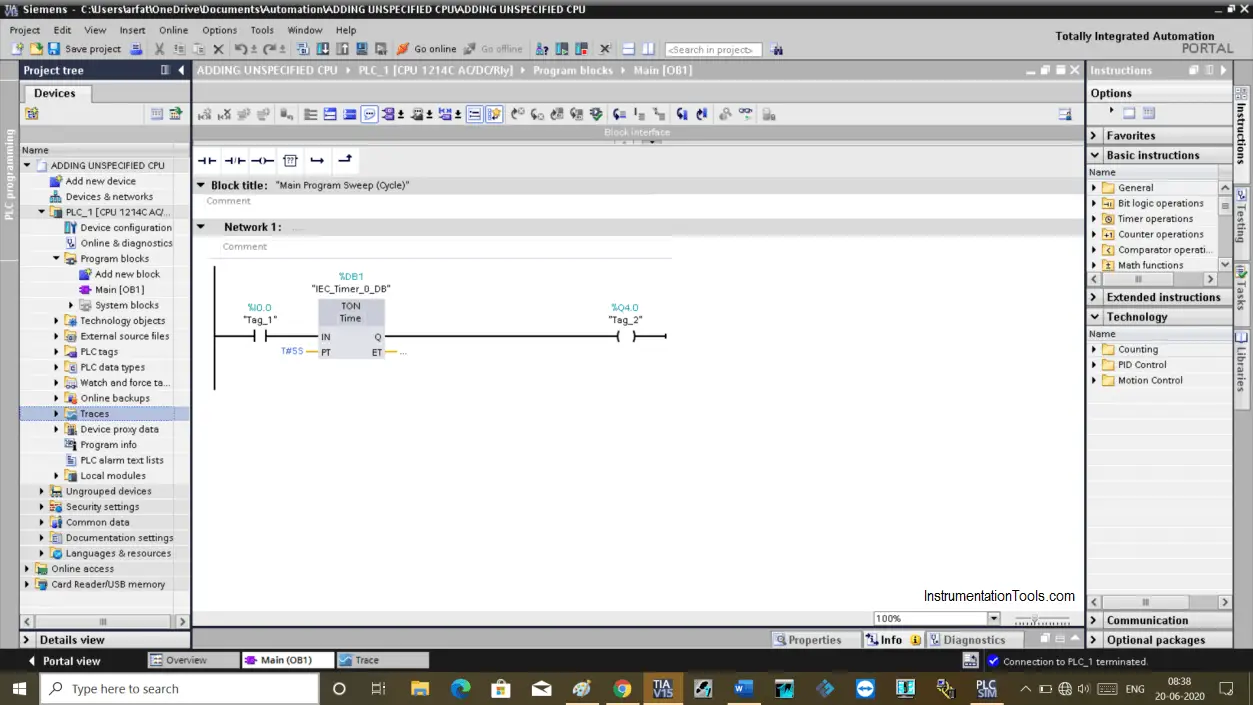
In our example, I will write a simple program to check the functionality of the trace function.
I have written a simple program to turn ON the output for the specified time.
Here, I want to monitor the timer. So, I have to use trace function to do that.
Step 3:
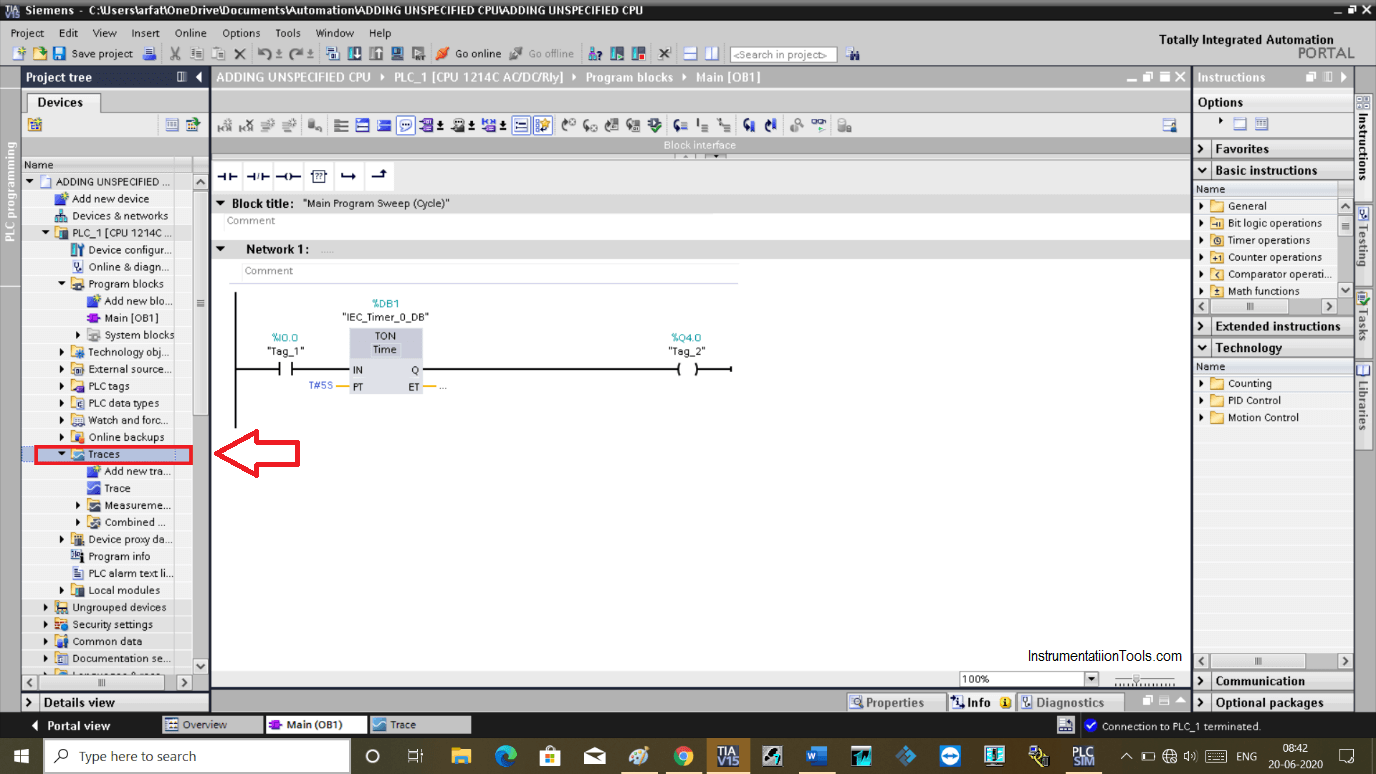
To Add timer go to “trace” as shown in the below window.
Expand “trace” and click on add new trace. Now click on a newly added trace.
Step 4:
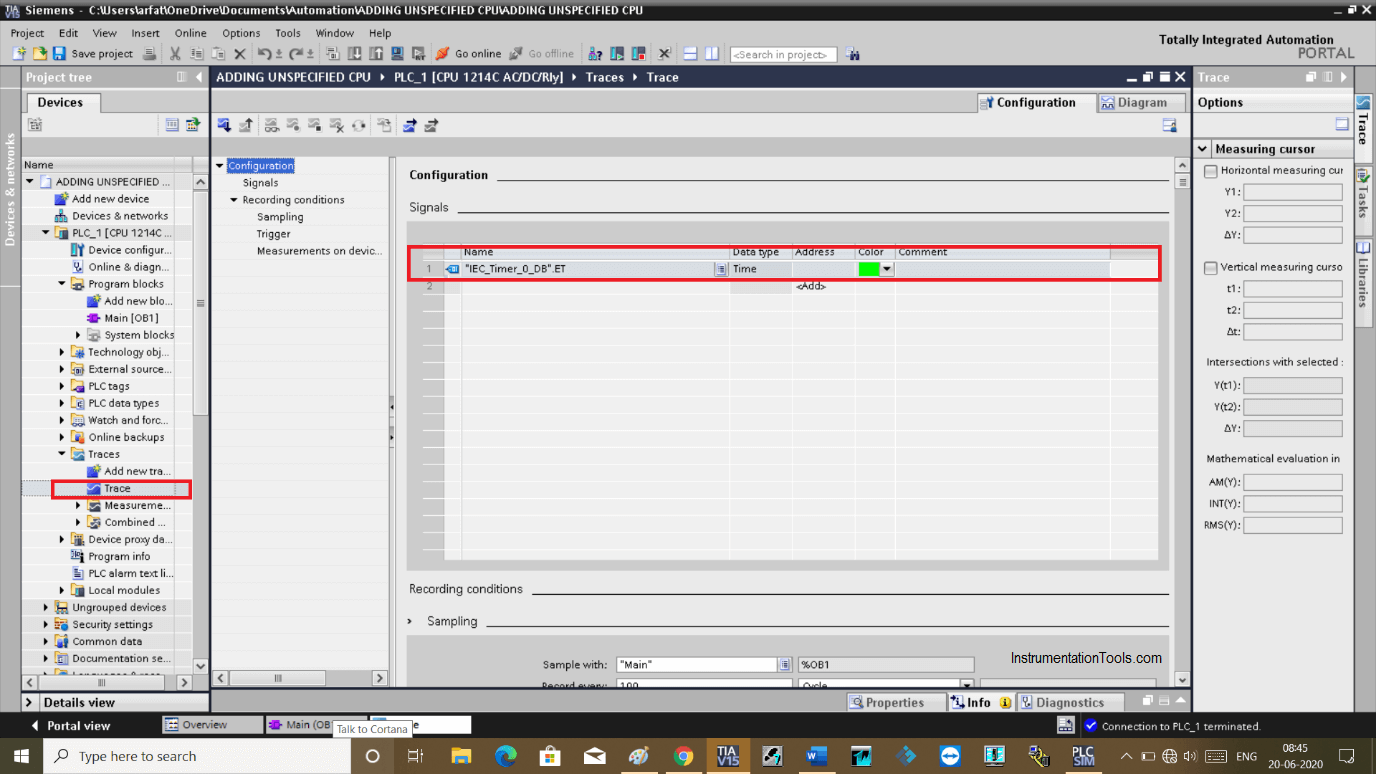
Double-clicking on the trace will open window as you can see below.
In “configuration” add a tag that you want to monitor. Here I have added timer.
Step 5:
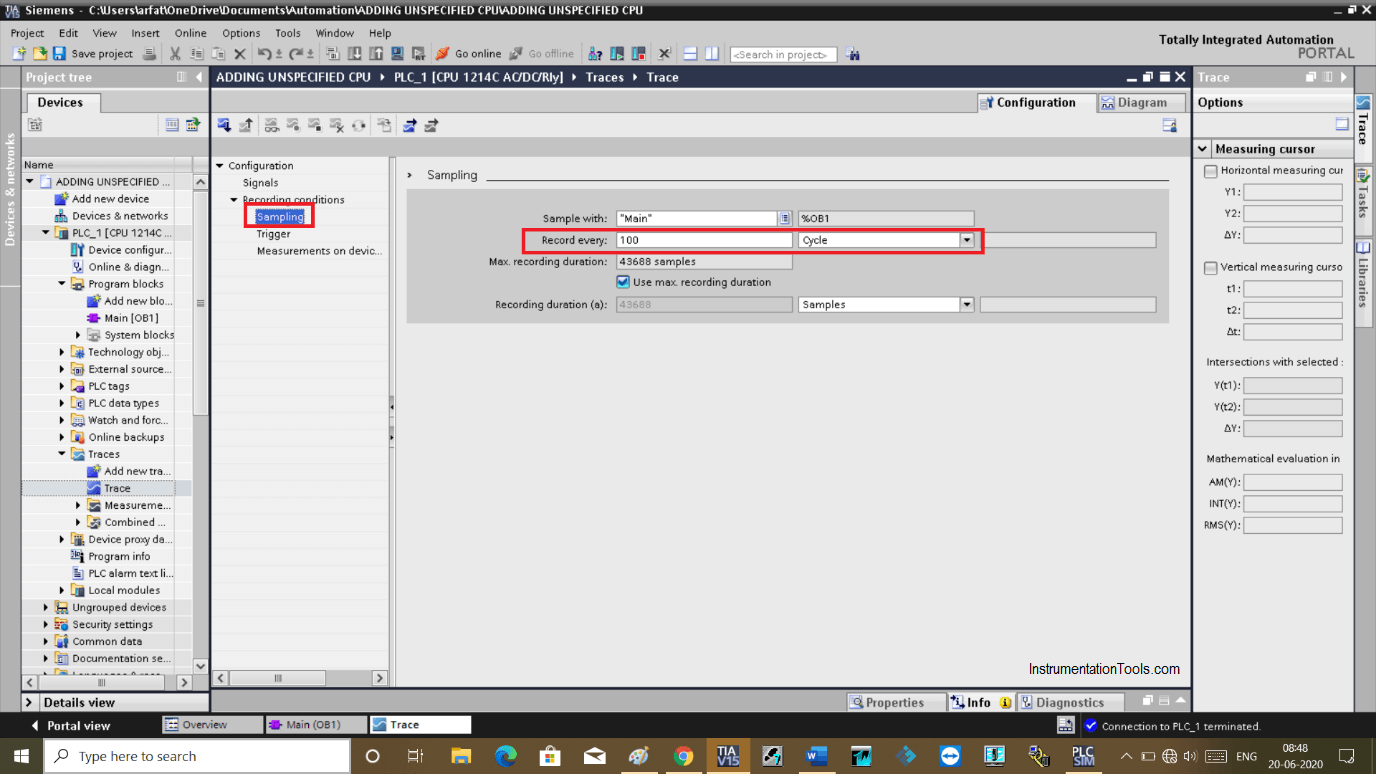
In “sampling” define your cycle to record data. Here, I choose 100 means that it will record data until 100 cycles.
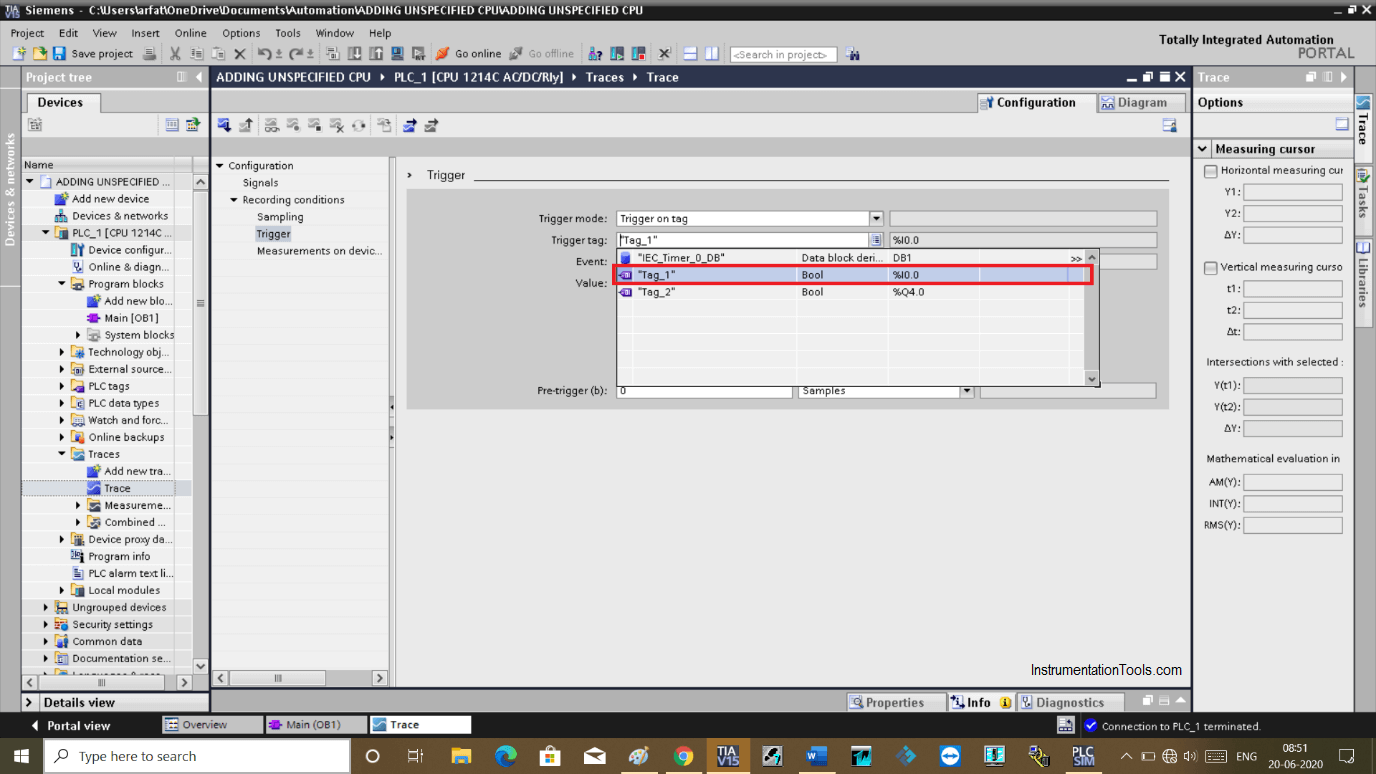
Step 6:
Here, in “trigger” choose when you want to start to record value.
Here I have chosen trigger when I will press the START button.
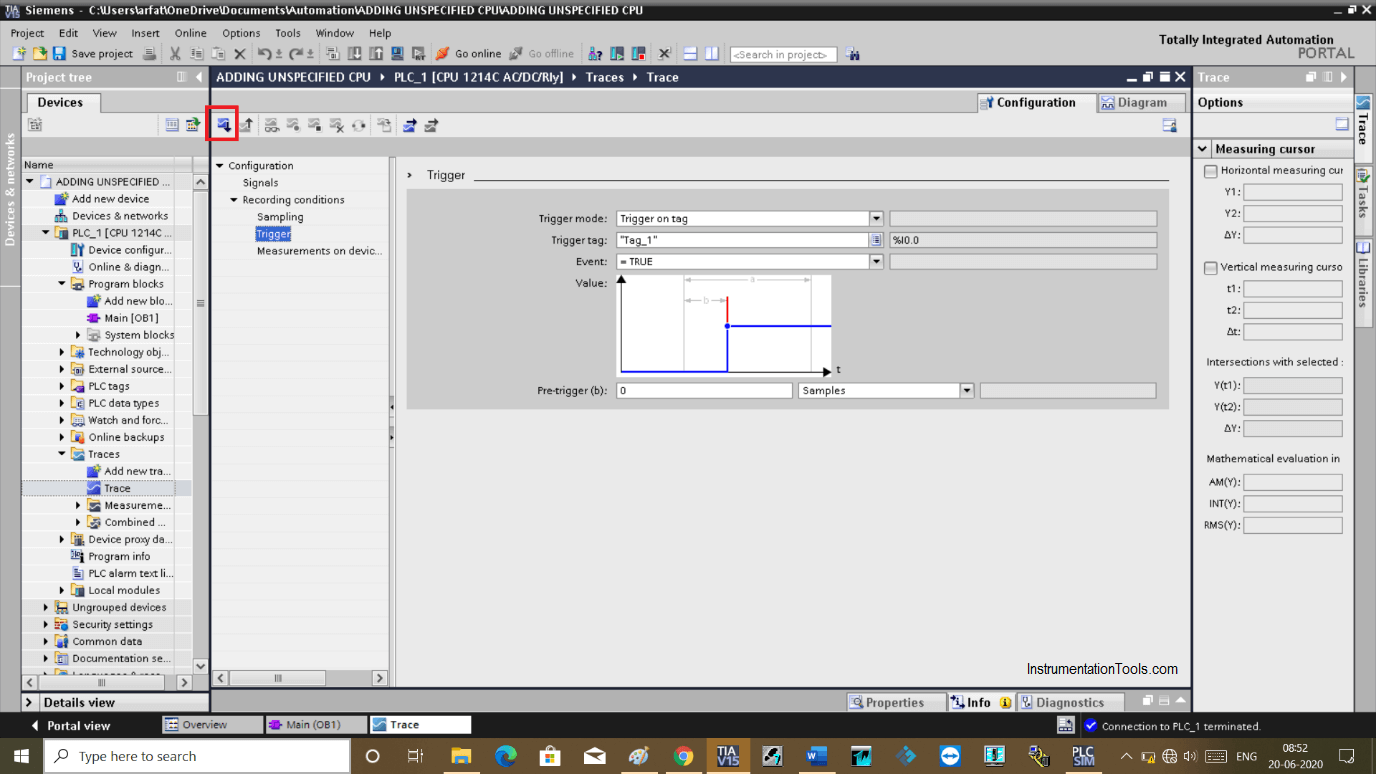
Step 7:
Now after configuration, click on the icon as shown in the red square to transfer trace configuration to the device.
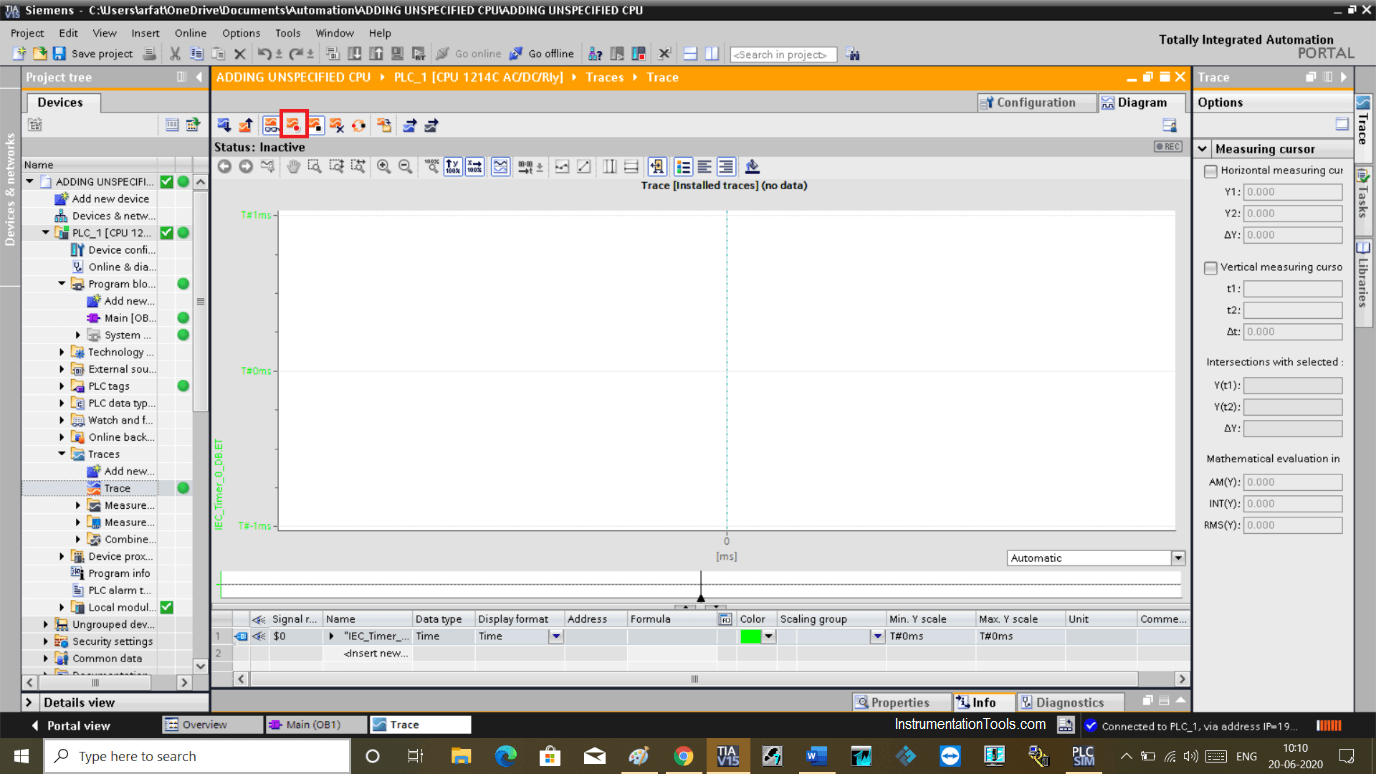
Step 8:
Clicking on the button will open up the record window.
Now click on an icon in the red circle to start recording.
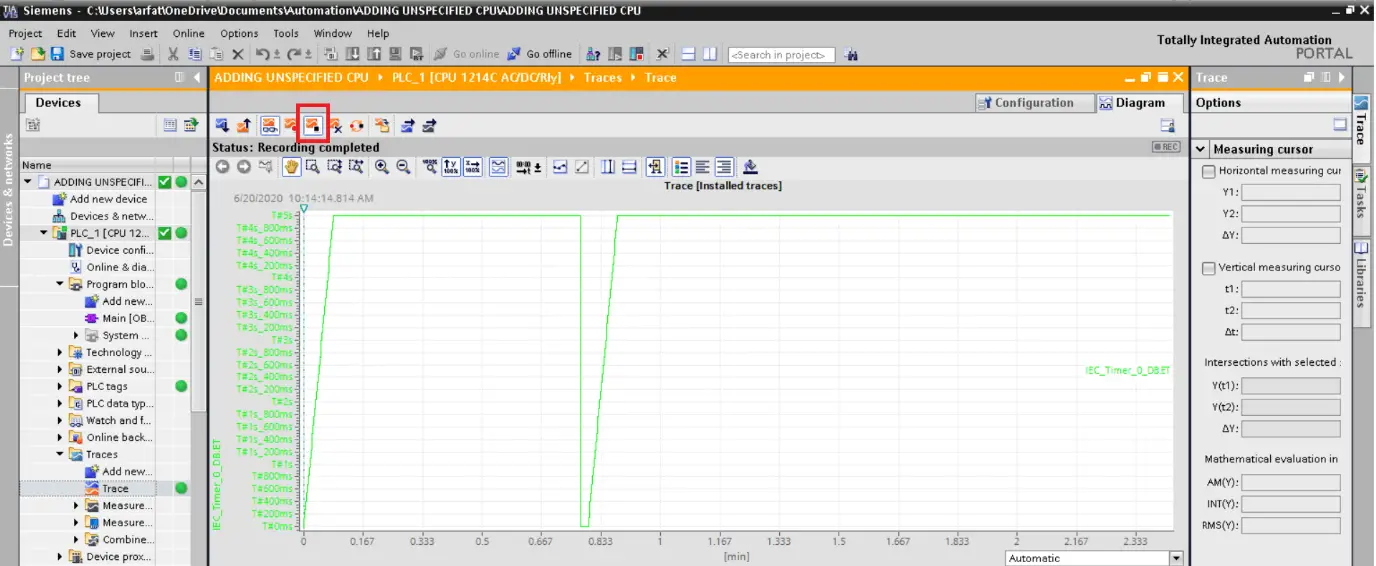
Step 9:
To monitor the tag, make sure to stay online in the simulation environment.
As you can see with turning ON switch, recording of the selected timer has started which is in our case timing of the 5 seconds.
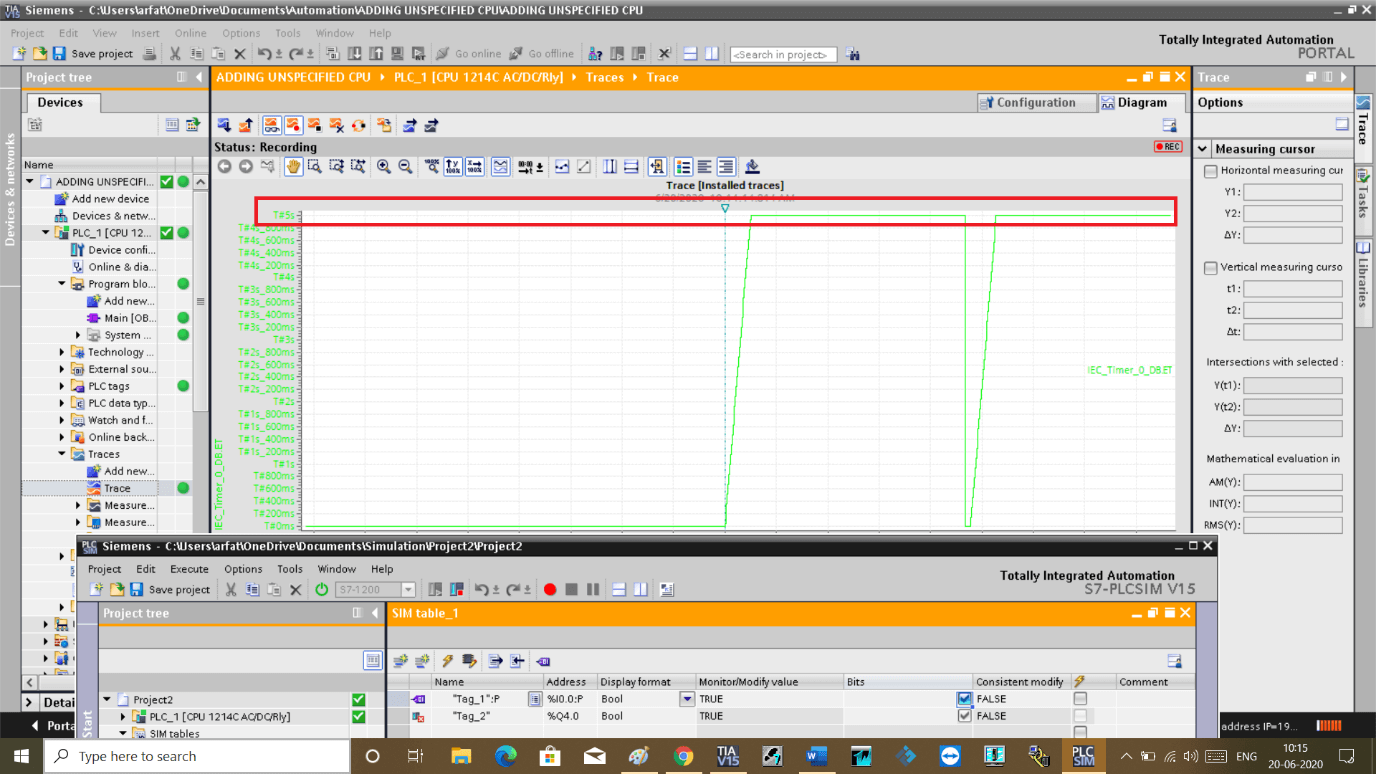
Step 10:
To stop the recording press the icon as shown in the below window.
You can add as many variables as you want to monitor their status.
Author: Suhel Patel
If you liked this article, then please subscribe to our YouTube Channel for PLC and SCADA video tutorials.
You can also follow us on Facebook and Twitter to receive daily updates.
Read Next:
- Upload Siemens PLC Program
- Digital Logic Functions
- Wonderware Intouch Project
- Memory Structure of Siemens
- Open Platform Communication