Instrumentation and control rely on converting physical or process variables into a more useful format for the operator display.
Pressure in a pipe is converted to mechanical deflection of a diaphragm, which is converted to electrical energy by a strain gauge (the diaphragm and strain gauge constitute a transducer), then to a numeric integer value by an I/O module, and then to a floating point engineering unit value by the PLC or HMI for display.
This information is also used to help generate output commands, which are converted into electrical signals and then to mechanical action. The trick is to understand the I/O relationships of the various converters.
How PLC Reads the Data from Field Transmitters

For example, a flow orifice will cause a predictable pressure drop as fluids flow across it. A pressure transmitter can measure this pressure drop by comparing the upstream pressure to the downstream pressure.
Though this pressure differential is not linear with flow rate, it has a repeatable relationship to it. This relationship is best approximated as a square-root function.
Taking the square root of the differential pressure signal effectively linearizes it with the flow rate.
After a linear relationship has been established, the entire conversion sequence from transmitter to computer display can be deduced from one measurement.
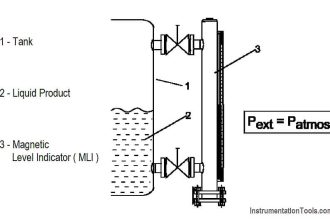
The below Figure depicts two typical temperature measurement circuits as follows: The top configuration uses the external power supply of the transmitter to power the signal loop.
This configuration is referred to as a four-wire loop. The bottom configuration uses an internal power supply (AI card Power) to power the loop. This configuration is referred to as a two-wire loop.

The following discussion about unit conversions applies to both circuit types. Focus on the top circuit.
A thermocouple is the sensing element. Thermocouples are devices that use the principle of bimetallic contact to generate a small millivolt signal.
Note that the temperature-voltage curve presented in the chart is relatively linear throughout the temperature interval.
Outside of that temperature interval, the signal can become less linear (a characteristic of a thermocouple), but that is of no importance here.

Instrument scaling must always begin at the process measurement. The designer consults the heat and material balance (HMB) sheet for our imaginary system and finds the expected temperature at the measurement point is approximately 105°C.
The upstream heater is capable of heating the system to approximately 130°C before it shuts down due to its over-temperature interlock.
The design engineer knows a properly calibrated span would place the normal operating point at about the middle of the curve. The upper end would need to be above 130°C.
After some thought, the engineer decides on a calibrated span of 15 to 150°C and chooses a type K thermocouple, which provides an output of 0.597 to 6.138 mV over that temperature interval.

The temperature transmitter, then, must be bench calibrated to provide a 4 -20 mA output signal that is proportional to the 0.597 to 6.138 mV input signal expected from the thermocouple.
The transmitter, being a current source (as opposed to a voltage source), varies its power output as necessary to maintain a steady milliamp output that is proportional to the millivolts on its input i.e. measured temperature reading.
(Note: A voltage source, such as a battery, tries to maintain a constant voltage regardless of load, while a current source tries to maintain a constant current regardless of load).
The temperature transmitter then converts this signal into a 4-20 mA signal that has been scaled, in this case for a span of 15 to 150°C.
The PLC has an analog input module that detects the output of the temperature transmitter. Virtually all analog input modules are voltmeters, even though they are listed as milliamp inputs.
Sometimes the resistor is external on the terminal strip, and sometimes it is internal on the PLC I/O module (shown in Figure). In either case, the 4-20 mA signal will be converted to a voltage.
Typically, this voltage is 1-5 VDC because the resistor used is 250 ohms. This analog value must then be converted to a binary value.
In our example, the PLC specification lists this particular PLC I/O module as having 12-bit resolution. To find the resolution of the module in terms of the process variable, perform a binary conversion: 212 = 4095.
So, for an input span of 1-5 VDC, the PLC I/O module provides an integer value to the PLC program that ranges from 0 to 4095.
The PLC program may fetch this data to use as needed. One of the possible actions of the PLC program is to move this data value into a network interface buffer (a series of contiguous locations in PLC memory) for transmittal upstream to the HMI.
The raw-count integer value is then made available for data transmittal across the network.
The HMI receives this transmitted data stream, which is then stored in an input data buffer. The HMI computer has a tag-file database, which contains instructions about how to manipulate each data item for presentation to the operator.
Many of the tags in the tag file are linked to data items in the input data buffer. One such tag is linked to this particular location.
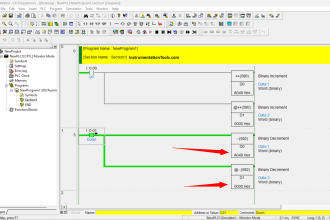
The 0 to 4095 raw value is extracted and converted to engineering units by use of the formula embedded in either the tag-file database or the graphic screen software that uses the information.
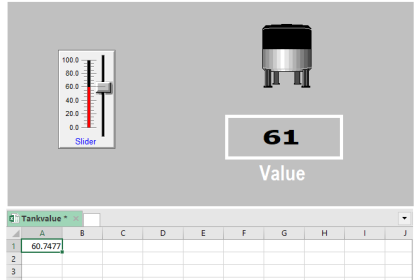
The formula in our sample case is shown in Below Figure.
The value produced (85.88) would be the value displayed to the operator in oC as follows in Below Figures:

If you liked this article, then please subscribe to our YouTube Channel for PLC and SCADA video tutorials.
You can also follow us on Facebook and Twitter to receive daily updates.
Read Next:
Limit, Selector, Override controls
Control Room Design Guidelines


Very Interesting Informative.please continue the series
thank you verry much for sharing this additional knowledge for me and all the newbie in the industry of instrumentation and control
Dear Mr.Bhardwaj
Kindly try to intoduce application for apple devices.it will be very greatful of u.
Very good infomation on this web site.
But I do Think you have the drawing for the tow wire transmitter wrong in you schematic here.
+ ————————— +24V – ———————————- I/O – This is often going to Earth.
transmitter
– —————————————————————————– I/O+
Or am I wrong
Very authentic and knowledge available from instrument tools web.
Kindly please discuss about temperature compensations.
Very grateful for the info been shared. Thumbs up to the efforts guys.
Very useful discussion.. thank you very much
Nice
One of the most interesting and thorough explanations for control systems and instrumentation related issues that is out there.Very good job sir.
Great stuff Sir
Super awesome information Sr. I love your sharing and feedback. Thanks
Thank you very much for such explanation with helpful images and examples.
I would like to point out a mistake:
For PLC I/O with 12-bit resolution, the resolution of the module is : 2^(12)-1 = 4095; meaning integers from 0 to 4095.
The calculation of 2^(12) = 4096.
Thank you.