Inst ToolsInst ToolsInst Tools
  • Courses
  • Automation
    • PLC
    • Control System
    • Safety System
    • Communication
    • Fire & Gas System
  • Instrumentation
    • Design
    • Pressure
    • Temperature
    • Flow
    • Level
    • Vibration
    • Analyzer
    • Control Valve
    • Switch
    • Calibration
    • Erection & Commissioning
  • Interview
    • Instrumentation
    • Electrical
    • Electronics
    • Practical
  • Q&A
    • Instrumentation
    • Control System
    • Electrical
    • Electronics
    • Analog Electronics
    • Digital Electronics
    • Power Electronics
    • Microprocessor
  • Request
Search
  • Books
  • Software
  • Projects
  • Process
  • Tools
  • Basics
  • Formula
  • Power Plant
  • Root Cause Analysis
  • Electrical Basics
  • Animation
  • Standards
  • 4-20 mA Course
  • Siemens PLC Course
Reading: Determine Voltage Drops at Respective Flow Rates in Loop Diagram
Share
Font ResizerAa
Inst ToolsInst Tools
Font ResizerAa
  • Courses
  • Design
  • PLC
  • Interview
  • Control System
Search
  • Courses
  • Automation
    • PLC
    • Control System
    • Safety System
    • Communication
    • Fire & Gas System
  • Instrumentation
    • Design
    • Pressure
    • Temperature
    • Flow
    • Level
    • Vibration
    • Analyzer
    • Control Valve
    • Switch
    • Calibration
    • Erection & Commissioning
  • Interview
    • Instrumentation
    • Electrical
    • Electronics
    • Practical
  • Q&A
    • Instrumentation
    • Control System
    • Electrical
    • Electronics
    • Analog Electronics
    • Digital Electronics
    • Power Electronics
    • Microprocessor
  • Request
Follow US
All rights reserved. Reproduction in whole or in part without written permission is prohibited.
Inst Tools > Blog > Control Systems > Determine Voltage Drops at Respective Flow Rates in Loop Diagram

Determine Voltage Drops at Respective Flow Rates in Loop Diagram

Last updated: February 2, 2020 11:46 am
Editorial Staff
Control Systems
5 Comments
Share
1 Min Read
SHARE

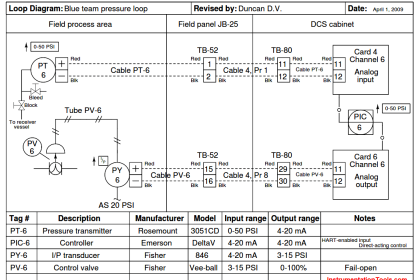
In Flow Control Loop, Trace the path of current in the loop diagram signal wiring, then determine voltage drops at the respective flow rates. Examine the following loop diagram:

Loop Diagram

Determine Voltage Drops at Respective Flow Rates

Trace the path of current in the signal wiring, then determine the following voltage drops at the respective flow rates. Assume a power supply voltage of exactly 24 volts DC:

Voltage across FY-14 resistor = __________ ; Flow rate = 100 GPM

Voltage between terminals TB40-3 and TB40-4 = __________ ; Flow rate = 200 GPM

Voltage across FT-14 transmitter terminals = __________ ; Flow rate = 175 GPM

Voltage between terminals TB64-8 and TB27-15 = __________ ; Flow rate = 200 GPM

Solution:

Flow Transmitter Loop Diagram

Voltage across FY-14 resistor = 2.6 volts ; Flow rate = 100 GPM

Voltage between terminals TB40-3 and TB40-4 = 19.8 volts ; Flow rate = 200 GPM

Share Your Answers for the remaining questions.

Credits: Tony R. Kuphaldt

Read Next:

  • Flow Meter Questions
  • Loop Diagram Questions
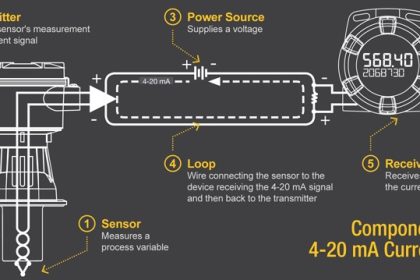
  • 4-20 mA Current Loop
  • Pressure Control Loop
  • Flow Control Loop
Don't Miss Our Updates
Be the first to get exclusive content straight to your email.
We promise not to spam you. You can unsubscribe at any time.
Invalid email address
You've successfully subscribed !

Continue Reading

30 Concerns for Process Control Systems Philosophy
Three Element Drum Level Control System
Interactions With Process Control Systems Philosophy
4-20 mA Transmitter Wiring Types : 2-Wire, 3-Wire, 4-Wire
Design Process Graphics in Factory Talk View Studio with an Analog Input
Types of Noise in Electronics
Share This Article
Facebook Whatsapp Whatsapp LinkedIn Copy Link
Share
5 Comments
  • Tarique says:
    February 10, 2020 at 9:25 pm

    How voltage across fy-14 is 2.6 volts at 100gpm can your ellaborate please???
    My mail id [email protected] or whatsapp no. +96660330861
    I dont know how it came please reply me

    Reply
  • S Bharadwaj Reddy says:
    February 10, 2020 at 9:44 pm

    From the diagram, the flow transmitter range is 0 to 250 gpm

    Now Calculate the loop current at 100 gpm, it is 10.4 mA

    Calculate Voltage, V = I.R = 10.4mA x 250 = 2.6 v

    You can use this online calculator: https://instrumentationtools.com/instrumentation-calculator/

    Reply
  • TG says:
    July 15, 2021 at 1:03 pm

    Voltage across FY-14 resistor = __________ ;
    Voltage between terminals TB40-3 and TB40-4 = __________ ;
    Voltage across FT-14 transmitter terminals = __________ ;
    Voltage between terminals TB64-8 and TB27-15 = __________ ;
    if 80 GMP. thank you.
    I need a sample.

    Reply
  • Jan Caspar Esguerra says:
    September 6, 2021 at 11:28 pm

    Voltage across FY-14 resistor = 2.6 Volts ; Flow rate = 100 GPM
    Voltage between terminals TB40-3 and TB40-4 = 24 volts ; Flow rate = 200 GPM
    Voltage across FT-14 transmitter terminals = 24 volts ; Flow rate = 175 GPM
    Voltage between terminals TB64-8 and TB27-15 = 24 volts ; Flow rate = 200 GPM

    Why is the voltage between terminals TB40-3 and TB40-4 = 19.8 volts ; Flow rate = 200 GPM? It should be 24 volts because the analog output and inputs is 4 to 24 mA and constant voltage of 24 voltage because parallel connection from the PS to FT

    Reply
  • Alikhan says:
    September 7, 2021 at 6:00 pm

    Hello guys!
    Correct answers:
    1. 2.6V
    2. 19.8V
    3. 20.2 V
    4. 0.0 V

    If you are still confused pls connect with me I will send my solution
    [email protected]

    Reply

Leave a Reply Cancel reply

Your email address will not be published. Required fields are marked *

Stay Connected

128.3kFollowersLike
69.1kFollowersFollow
210kSubscribersSubscribe
38kFollowersFollow

Categories

Explore More

Capacitive Coupling Effects
Purpose of Gateways, Bridges & Routers in Networking
Readings Mismatch between Field & Control Room ? Why
PID Controller Gains Effect on Manipulated Variable
Process Control Instrumentation Glossary
Steady-State Process Gain
Runaway Processes
Types of Surge Control for Parallel Gas Compressors

Keep Learning

Basics of FOUNDATION Fieldbus

Difference between Fieldbus, Profibus and HART Protocols

Difference Between Optical Fibre and Coaxial Cable

Difference Between Optical Fibre and Coaxial Cable

Demo of a SCADA Software – Level Control System

Process Dynamics and PID Controller Tuning

Process Dynamics and PID Controller Tuning

Modbus in Industrial Networks

How Modbus is used in Industrial Networks?

Override Control Functions

Override Control Functions

System Architecture in Industrial Automation

How to Design a System Architecture in Industrial Automation?

What is FAT and SAT?

What is FAT and SAT? Difference between them

Learn More

Power Electronics Objective Questions

Power Transistor Quiz

Steam Generator Parts

Parts and functions of Steam Turbine

Split Range Control for Temperature Control Application

Split Range Control Working Principle

Scaling Sensor Output to Engineering Units

Scaling Sensor Output to Engineering Units

MTech Project Ideas for Electronics and Electrical Engineering

100 MTech Project Ideas for Electronics and Electrical Engineering

Closed Tank Level Measurement using DP Transmitter

Cat and Mouse type Level Indicator

Capacitor Principle

Capacitor

Interposing Relay Panel (IRP)

Interposing Relay Panel (IRP) – Wiring and Testing Requirements

Menu

  • About
  • Privacy Policy
  • Copyright

Quick Links

  • Learn PLC
  • Helping Hand
  • Part Time Job

YouTube Subscribe

Follow US
All rights reserved. Reproduction in whole or in part without written permission is prohibited.
Welcome Back!

Sign in to your account

Username or Email Address
Password

Lost your password?