This article is about the configuration of trends using InTouch SCADA programming with the help of a tank filling example.
Trends in SCADA / HMI is very useful to track, monitor, calculate, to diagnose useful process parameters from the past saved trend data.
You can keep a record of all the process data in the form of a graph, and it is called a trend.
Let’s learn how to track and generate a trend using Wonderware SCADA.
Step 1:
Open InTouch SCADA. Create a new project.
Step 2:
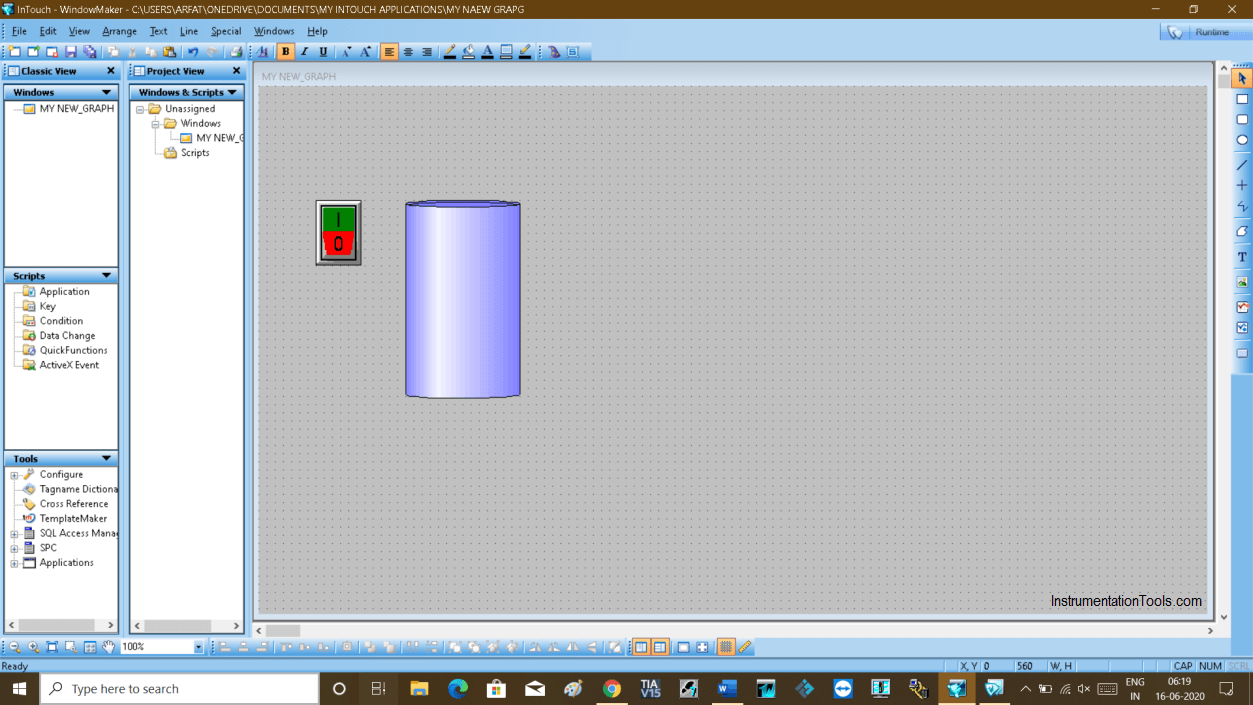
Here, I will use an example of a tank filling to monitor the level in the tank. I cannot simulate a real-time sensor, so I will add a switch to start filling the tank.
Add tank and switch as shown in the below window. Give tag name to tank and switch. I have explained in my previous article on how to give tag name to an object.
Here, my purpose is to make you familiar with trends, so I will only go through it.
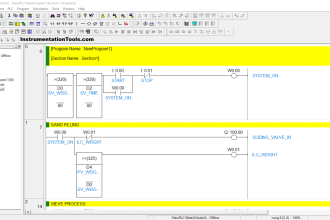
I have added a script to fill and empty the tank.
Step 3:
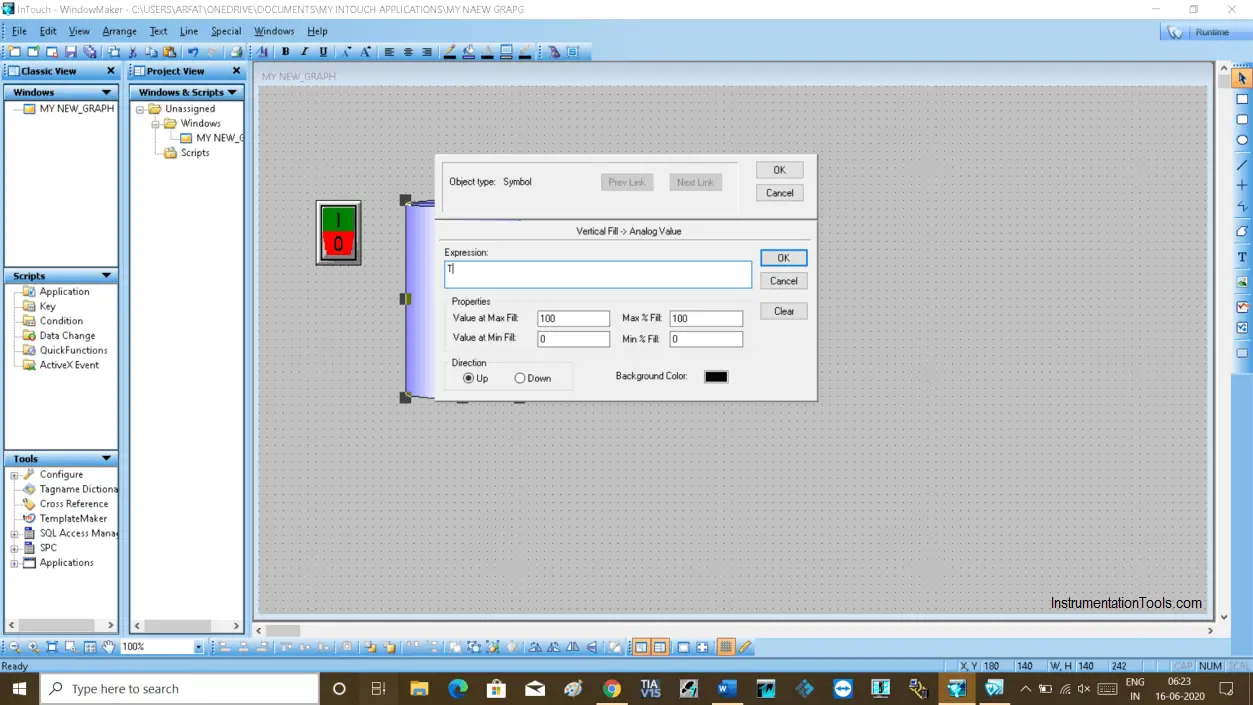
Here I have used “T” as a tag name for a tank as we want to monitor the level of the tank, we need this tag name.
Step 4:
To add trends mainly you have two options.
- Real-time trends (Only works in a real-time environment, If you close the window you will lose the data)
- Historical trends (In historical you can store the data and check data at any time)
Here, I will cover both of them. Let’s talk first about adding Real-time trends.
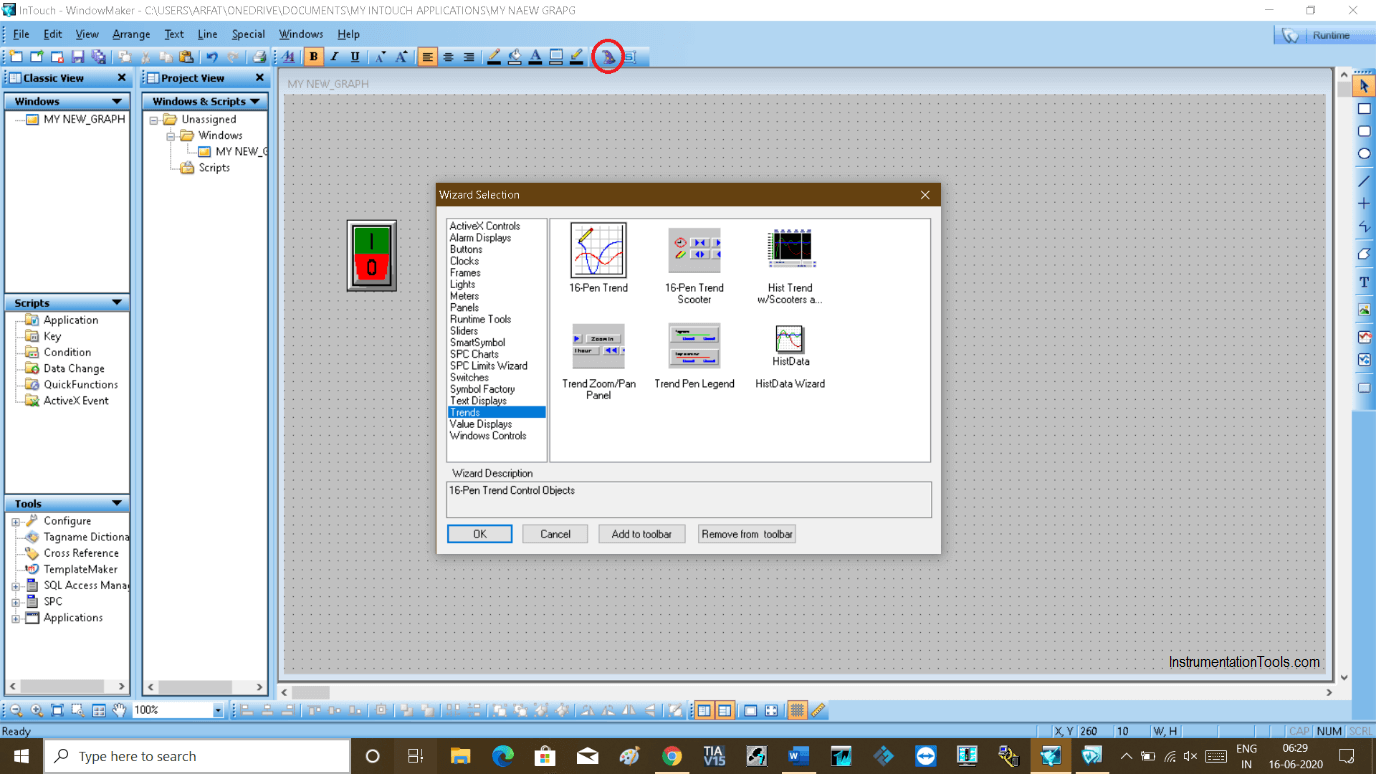
To add trend, click on the “wizard” icon as shown in the below window.
Click on “Trends” and select “16-pen trends”. Hit “ok” to proceed.
Step 5:
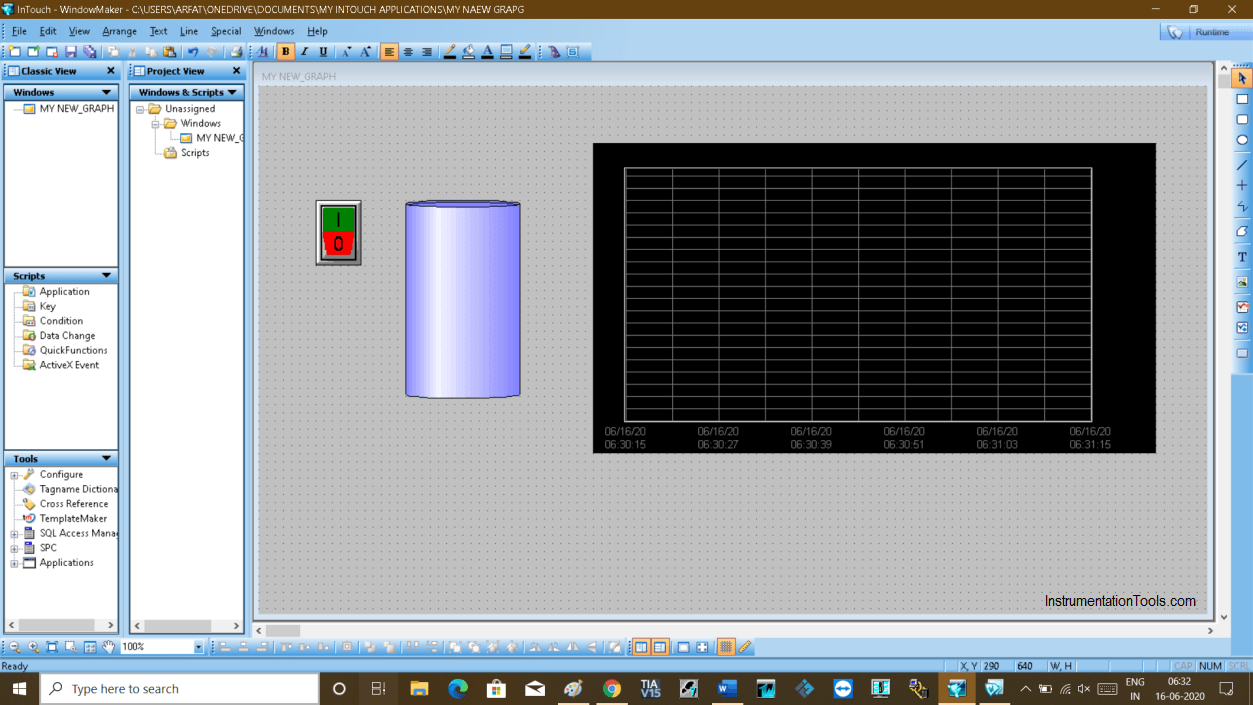
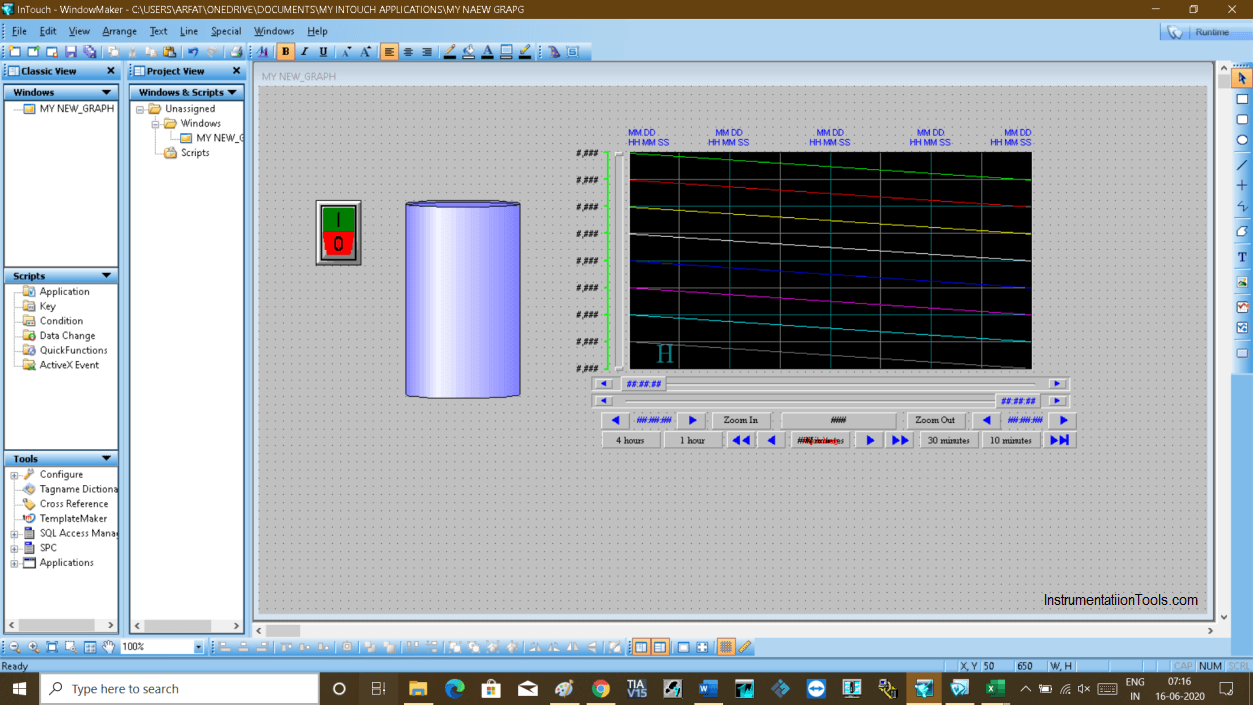
A real-time trend is added to the window.
Step 6:
Double click on trend then a new pop-up will open.
Here 16-pen means you can add 16 types of process variables to trend the data.
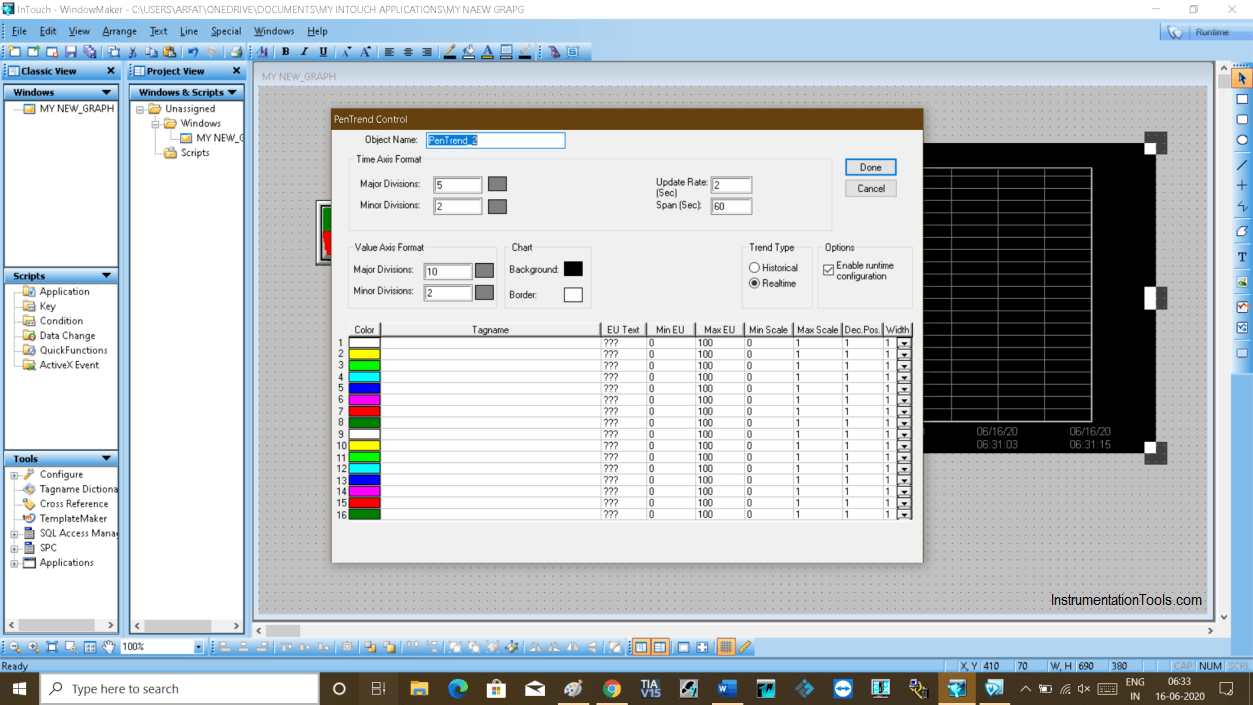
Step 7:
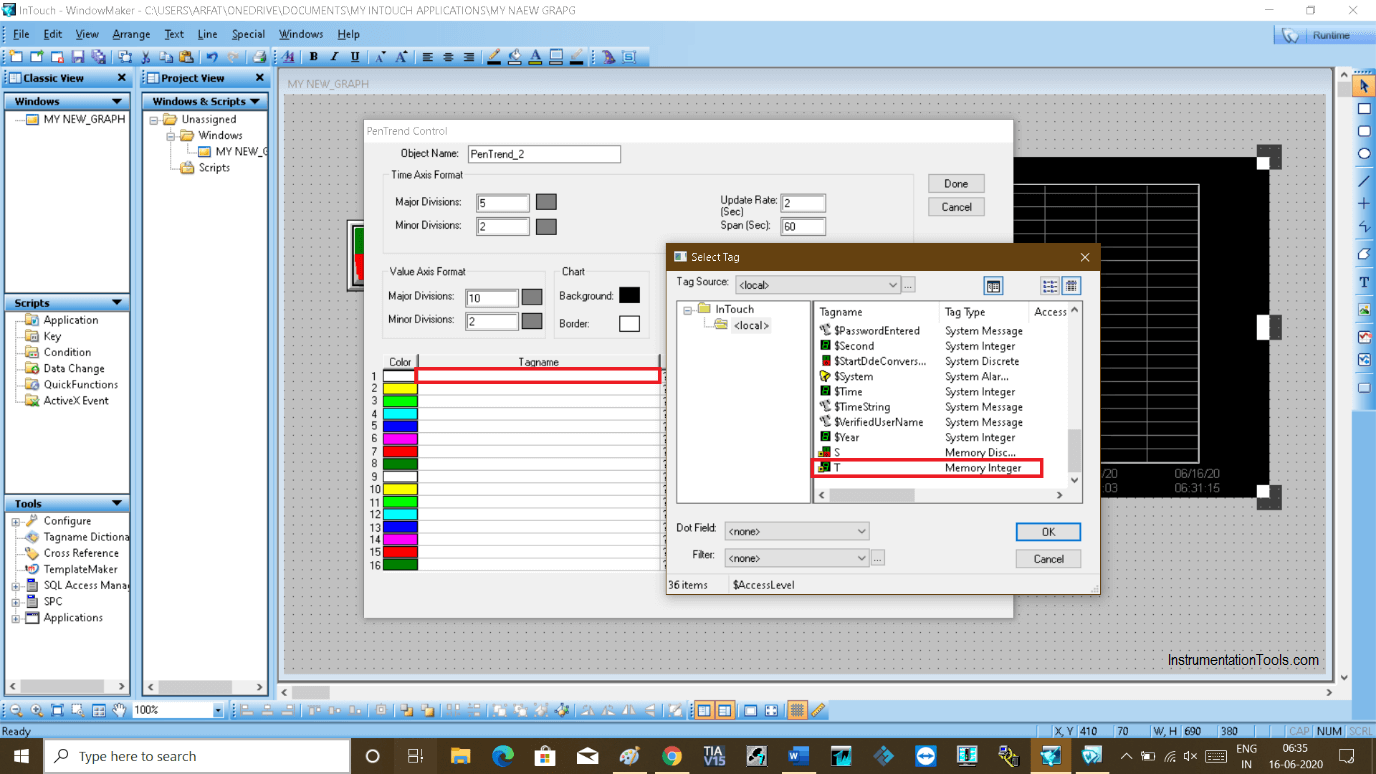
Now, double click on the space as indicated in the window that will open a new pop-up.
Find and select a tag name that you want to name the tank. Here I used “T”.
Step 8:
Close the pop-up window and again double click on the same location. Now the tag name “T” is added.
Double-clicking on it will open up a new pop-up.
Do checkmark on “log data” and also change the range as shown in the below window. Click “Done” to proceed.
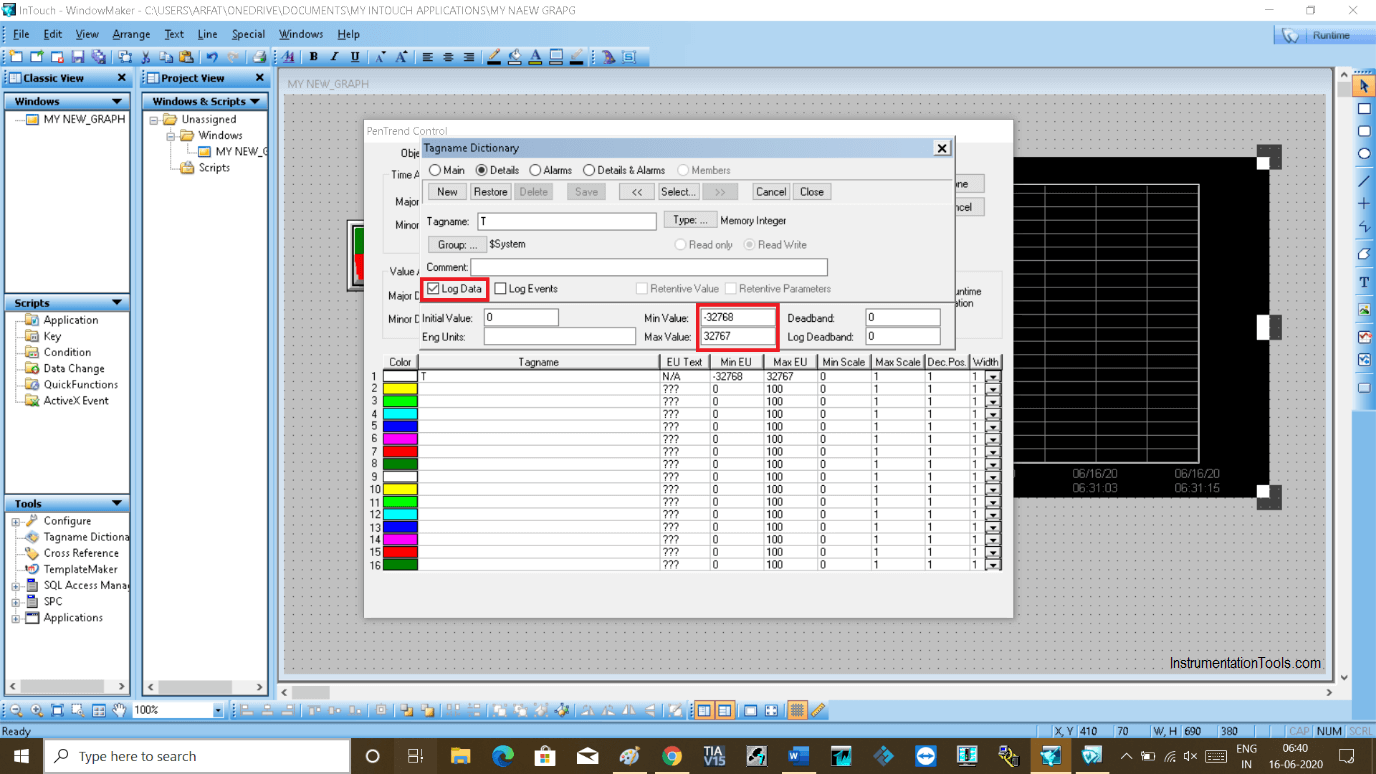
Step 9:
Now you are done with a Real-time graph. Now we can monitor the tank level by entering in to runtime mode.
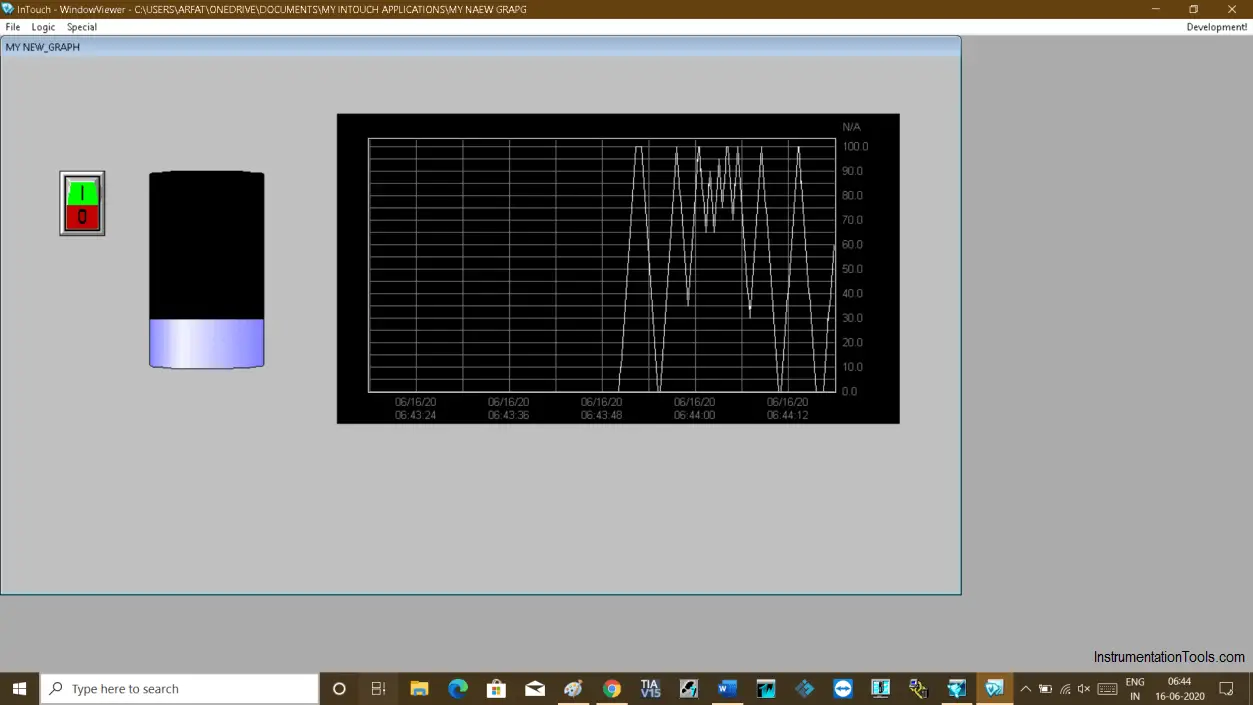
Step 10:
Now I will add a Historical trend as shown in the below window.
Again, double click on the trend to add the tag name of the tank.
Step 11:
The following window will open up. Give any name and click on “pens” to add the tag name of the tank.
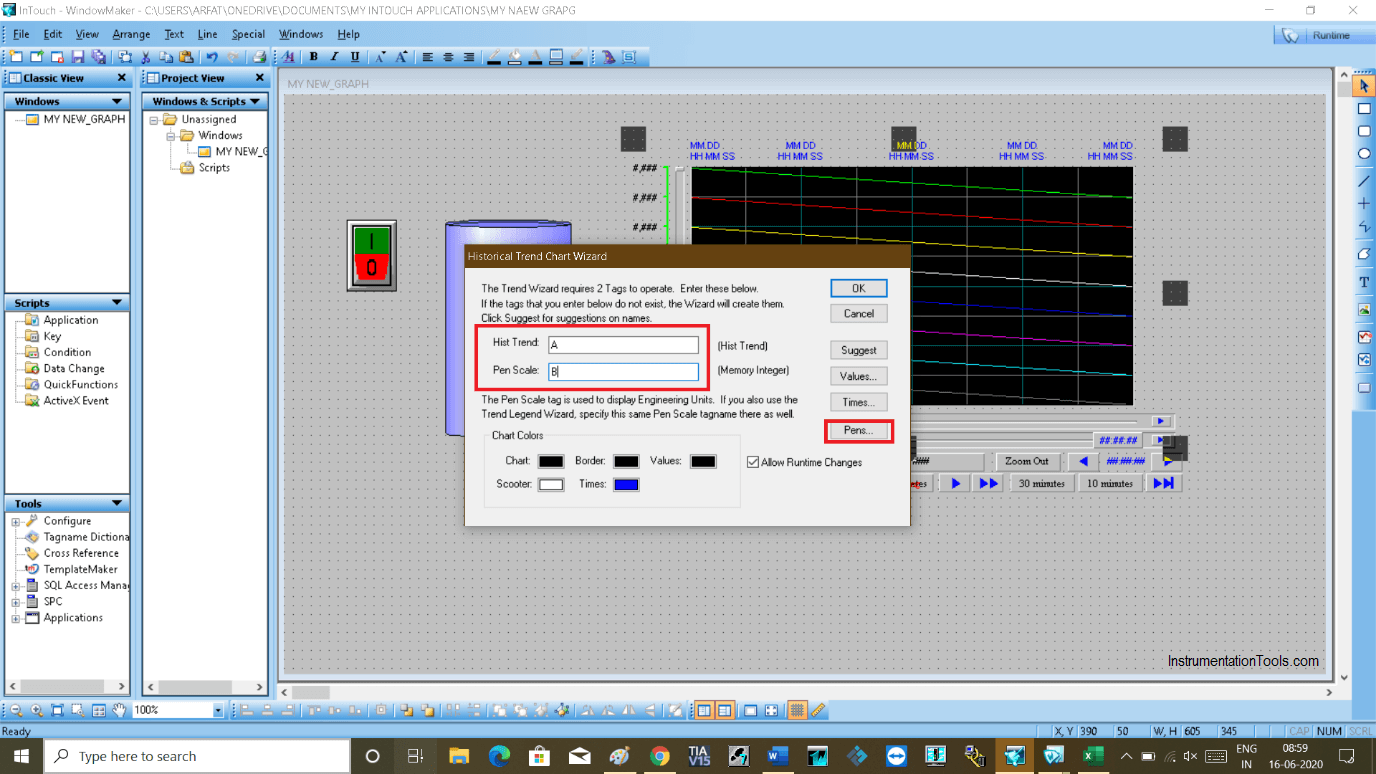
Step 12:
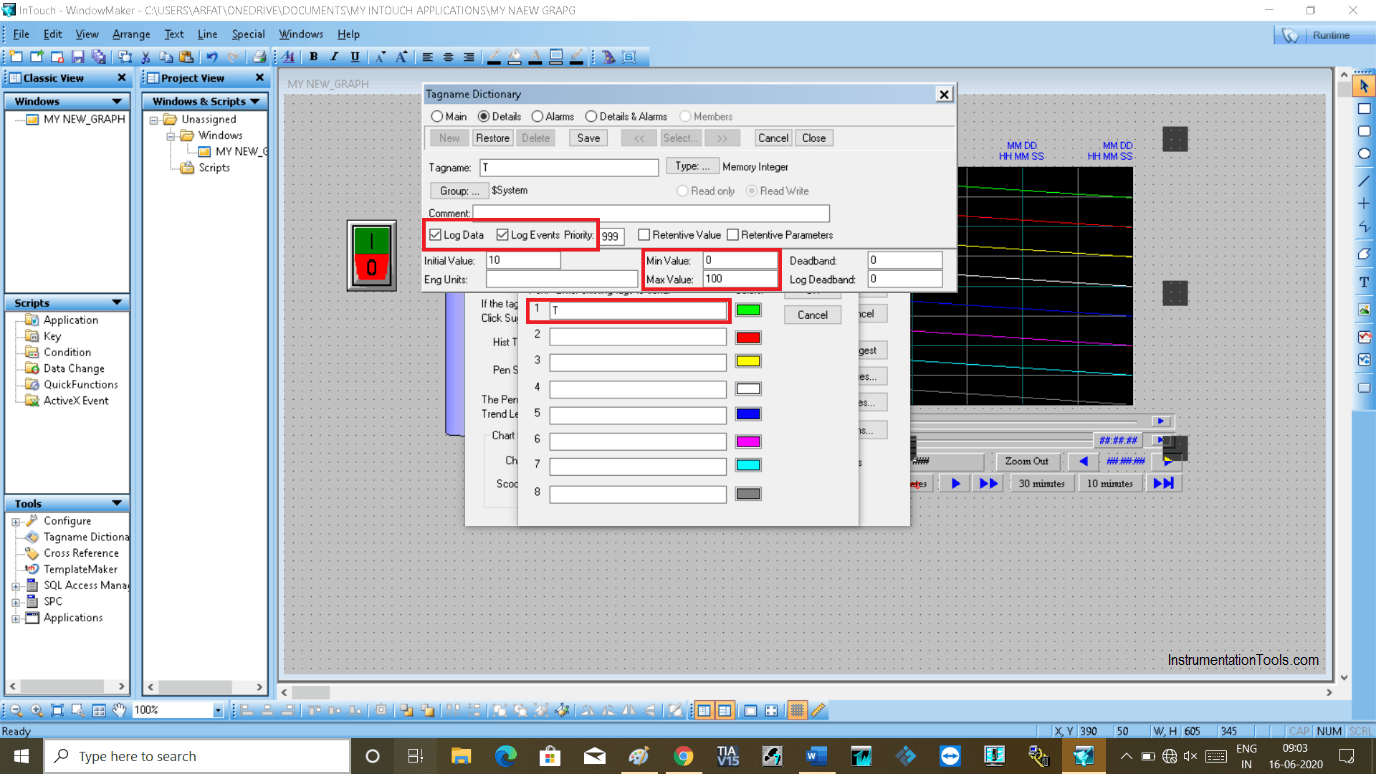
Clicking on pens will open up a new window as shown in the below window.
Add tag name to it. Double click on the space where you have added tag name.
Do the right checkmark as shown in the window. Choose range and click “ok” to proceed.
Step 13:
To active Historical logging, do follow the steps as shown in the below window.
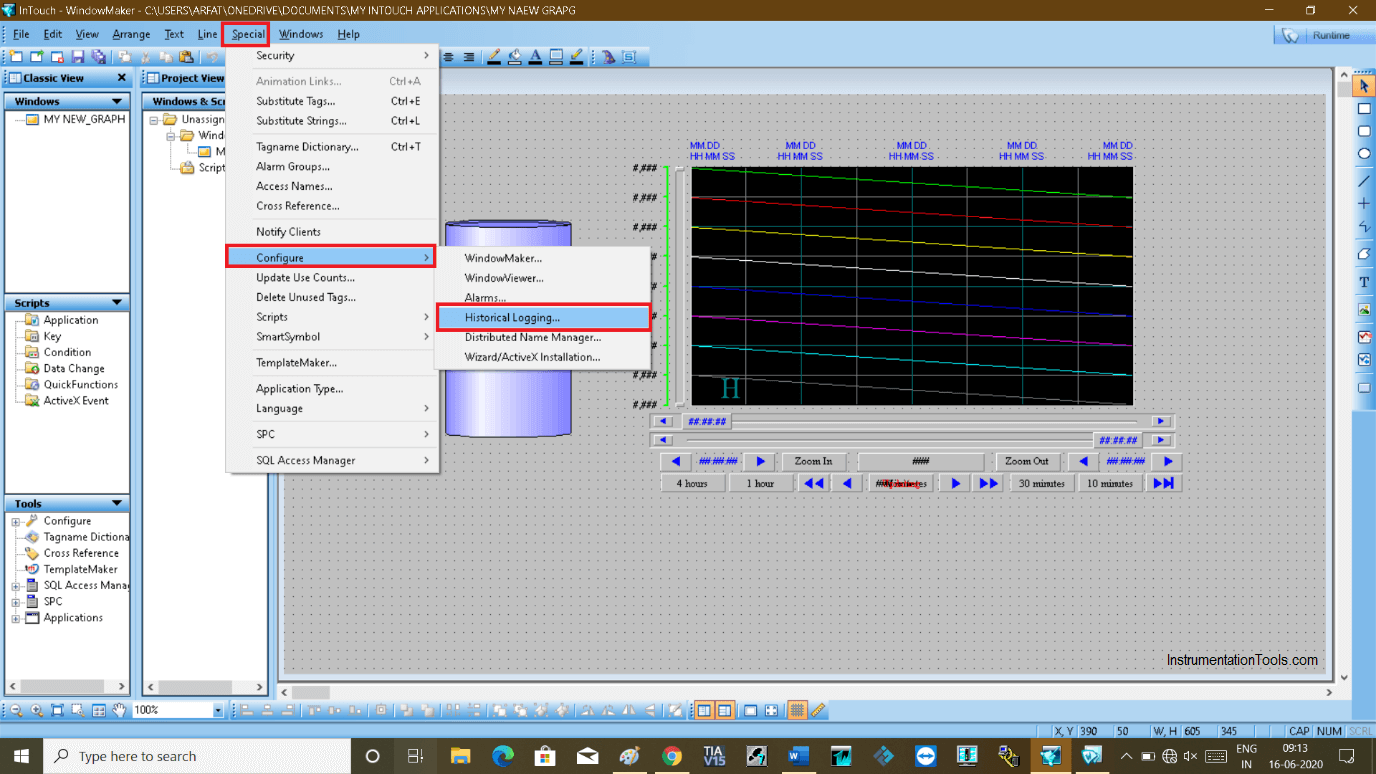
Step 14:
Do checkmark on “historical logging” and set days to store the data. It will only store the trend data for this number of days only.
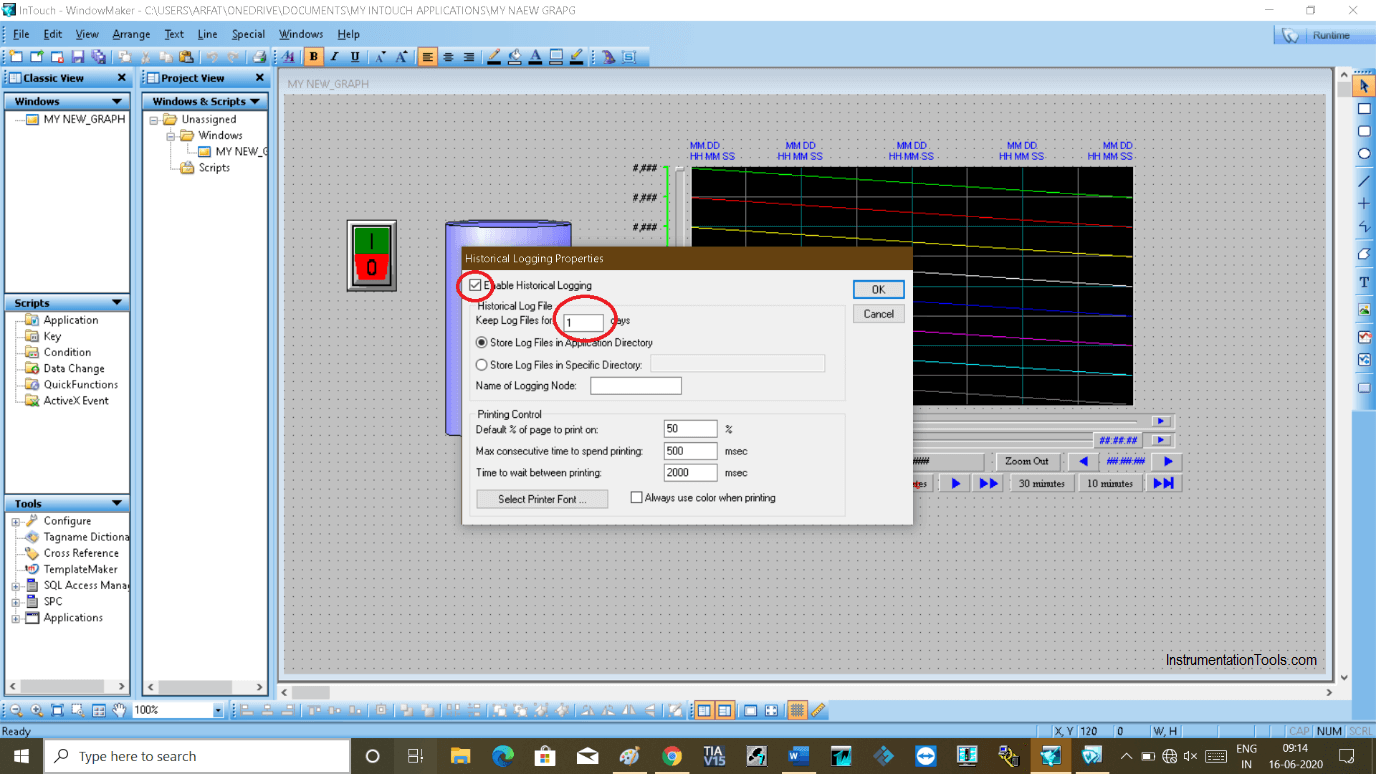
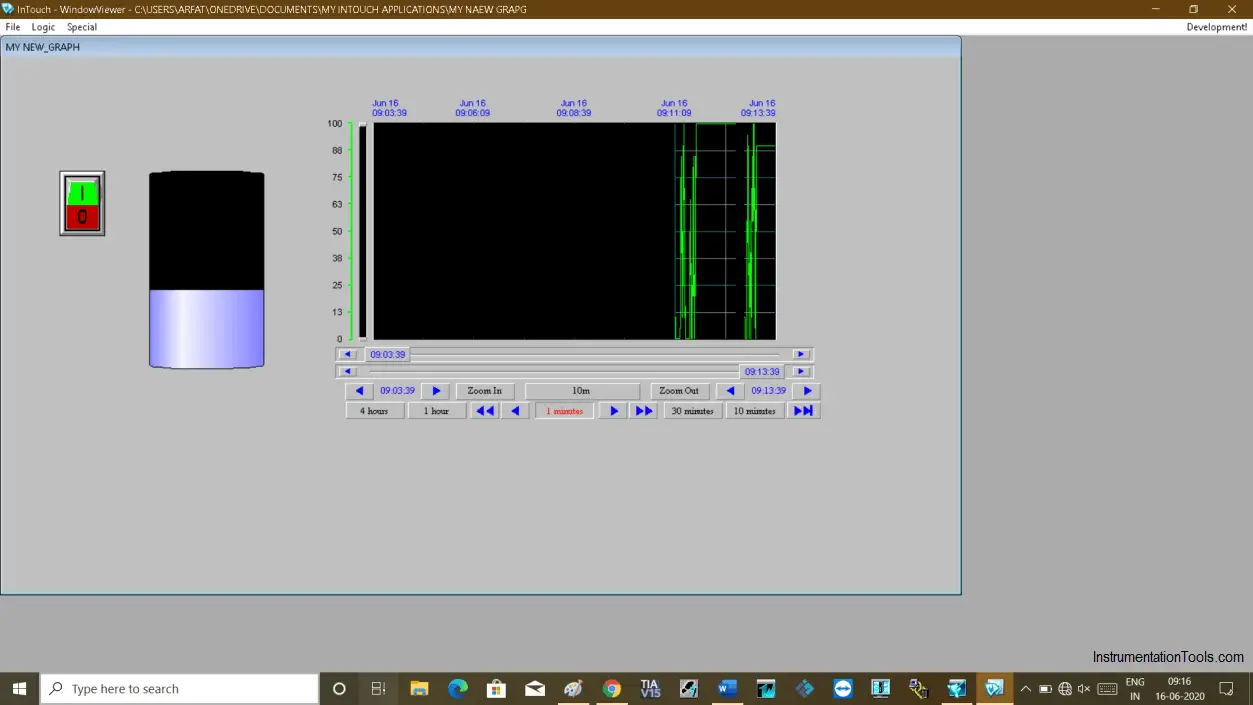
Step 15:
You can see trends in the runtime window.
Author: Suhel Patel
If you liked this article, then please subscribe to our YouTube Channel for PLC and SCADA video tutorials.
You can also follow us on Facebook and Twitter to receive daily updates.
Read Next:
- Instrumentation Mistakes
- HMI Project using Tia Portal
- Factory IO and Siemens Tia Portal
- Communication – WinCC & Tia Portal
- Configure an Alarm in InTouch


Let’s explore Wonderware InTouch through an example scenario to better understand how it incorporates the trends mentioned earlier. Imagine you’re working in a water treatment plant that uses Wonderware InTouch SCADA to monitor and control various processes, such as water filtration, chemical dosing, and pump operations.
### **Scenario: Water Treatment Plant**
#### **1. Web-Based and Mobile Access**
**Example:**
As the plant manager, you’re offsite but need to check the current status of the water filtration system. Using InTouch’s web-based access, you log into the SCADA system from your tablet. You can see real-time data, such as water levels, filtration rates, and pump status. You can also receive alerts and control the system remotely if needed, ensuring continuous operation even when you’re not physically at the plant.
#### **2. Integration with IIoT**
**Example:**
Sensors throughout the plant collect data on water quality, such as pH levels, turbidity, and chlorine concentration. These sensors are connected to the IIoT network, sending data to the InTouch SCADA system. InTouch processes this data and provides you with a real-time dashboard displaying trends and anomalies. If a sensor detects abnormal pH levels, InTouch can trigger an automated adjustment in the chemical dosing system to correct it, preventing potential water quality issues.
#### **3. Enhanced Security Features**
**Example:**
Given the critical nature of water treatment, security is paramount. InTouch requires all users to log in with multi-factor authentication, ensuring that only authorized personnel can access the system. Communications between your SCADA system and remote devices are encrypted to prevent unauthorized access. The system also logs all actions taken by operators, so you can audit any changes made to the plant’s processes.
#### **4. Advanced Data Analytics and Visualization**
**Example:**
InTouch provides a trend analysis tool that lets you visualize the plant’s historical data. You notice a recurring pattern where the chemical dosing spikes during specific times of the day. By analyzing these trends, you determine that the spikes correlate with peak water usage times. You can adjust the dosing schedule to optimize chemical use, reducing waste and operational costs.
#### **5. Cloud Integration**
**Example:**
Your water treatment plant is part of a larger network of plants across the region. Data from each plant is uploaded to a central cloud platform. From your office, you can compare performance metrics across all plants using InTouch’s cloud integration. This helps you identify best practices and share them across the network, improving overall efficiency.
#### **6. Interoperability with Other Systems**
**Example:**
InTouch is integrated with the plant’s maintenance management system. When InTouch detects a decline in pump efficiency, it automatically generates a maintenance request in the system. This request schedules a technician to inspect the pump, ensuring that potential failures are addressed before they cause downtime.
#### **7. Artificial Intelligence (AI) and Machine Learning (ML)**
**Example:**
InTouch uses AI to predict equipment failures based on historical data. For instance, it analyzes past performance data of a particular pump and predicts when it’s likely to fail. This prediction triggers a preemptive maintenance check, allowing you to replace the pump before it fails, thereby avoiding unplanned downtime.
#### **8. User Experience (UX) and Interface Improvements**
**Example:**
InTouch has a user-friendly interface that allows operators to customize their dashboards. One operator prefers to see detailed graphs of water quality metrics, while another prefers an overview of system alarms and status indicators. Each can tailor their workspace to suit their needs, improving efficiency and reducing errors.
#### **9. Sustainability and Energy Management**
**Example:**
InTouch tracks energy usage across the plant, providing insights into which processes consume the most power. By analyzing this data, you identify that the aeration process is particularly energy-intensive during peak hours. You adjust the operation schedule to run more energy-efficiently during off-peak times, reducing overall energy consumption and costs.
#### **10. Real-Time Data Processing**
**Example:**
During a heavy rainstorm, the inflow to the water treatment plant spikes. InTouch processes this data in real-time, adjusting the pump speeds and opening additional filtration channels to handle the increased volume. This immediate response prevents overflow and ensures that the plant continues to operate smoothly despite the sudden change in conditions.
### **Summary**
In this water treatment plant scenario, Wonderware InTouch SCADA demonstrates its ability to integrate modern trends, such as mobile access, IIoT, security, analytics, cloud computing, and AI. These capabilities enhance the plant’s operational efficiency, safety, and sustainability, showcasing the versatility and power of InTouch in a real-world industrial environment.