The Loop diagram sometimes called a loop sheet.
Loop Diagrams
Here we are discussing for the compressor surge control system (loop number 42):
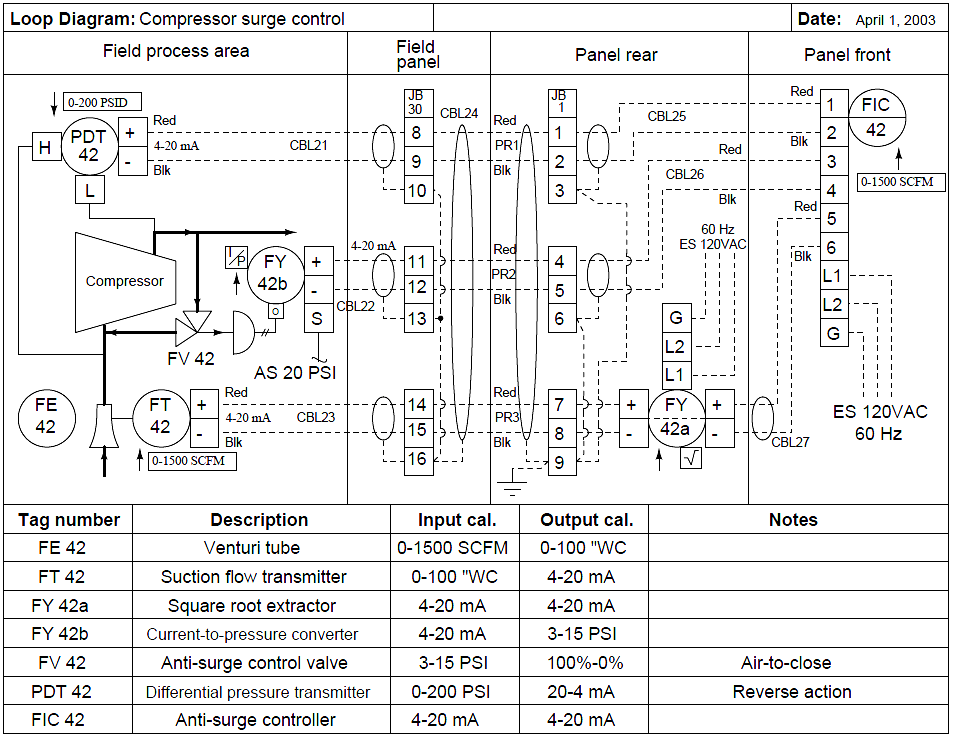
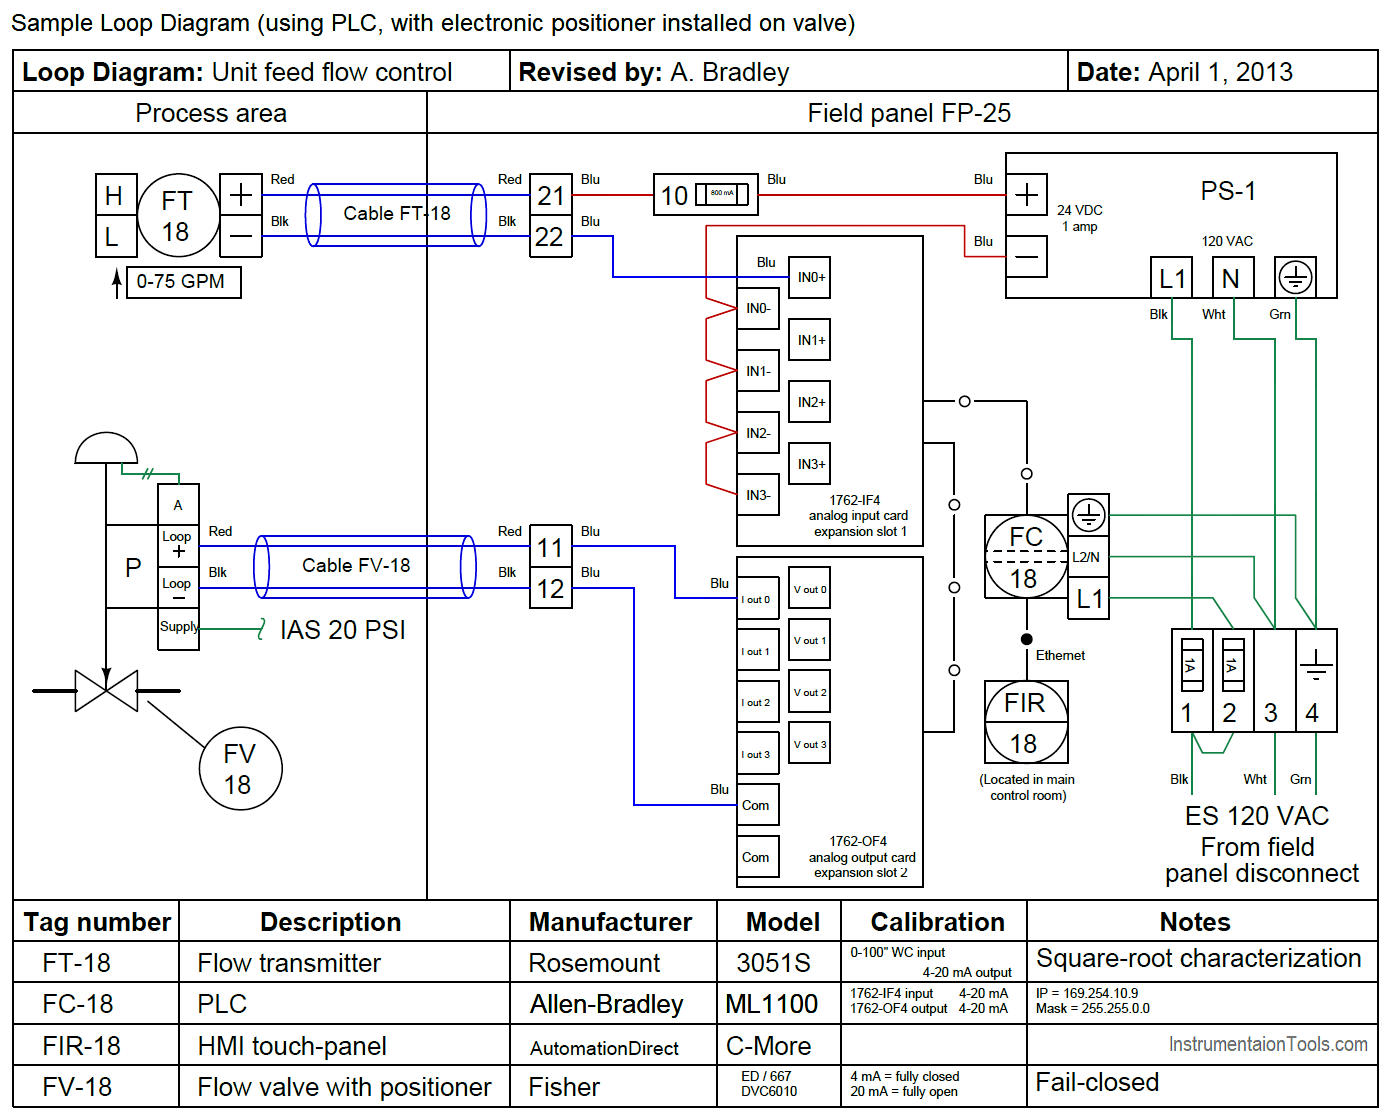
Here we see that the P&ID didn’t show us all the instruments in this control “loop.” Not only do we have two transmitters, a controller, and a valve; we also have two signal transducers. Transducer 42a modifies the flow transmitter’s signal before it goes into the controller, and transducer 42b converts the electronic 4 to 20 mA signal into a pneumatic 3 to 15 PSI air pressure signal. Each instrument “bubble” in a loop diagram represents an individual device, with its own terminals for connecting wires.
Note that dashed lines now represent individual copper wires instead of whole cables. Electrical terminals where these wires connect to are represented by squares with numbers in them. Fluid ports on instruments are also represented by labeled squares. Cable numbers, wire colors, junction block numbers, panel identification, and even grounding points are all shown in loop diagrams.
The only type of diagram for this system more detailed than a loop diagram would be an electronic schematic diagram for an individual instrument, which of course would only show details pertaining to that one instrument. Thus, the loop diagram is the most detailed form of diagram for a control system as a whole, and as such it must contain all details omitted by PFDs and P&IDs alike.
To the novice it may seem excessive to include such trivia as wire colors in a loop diagram. To the experienced instrument technician who has had to work on systems lacking such documented detail, this information is highly valued.
The more detail you put into a loop diagram, the easier it makes the inevitable job of maintaining that system at some later date. When a loop diagram shows you exactly what wire color to expect at exactly what point in an instrumentation system, and exactly what terminal that wire should connect to, it becomes much easier to proceed with any troubleshooting, calibration, or upgrade task.
Loop diagrams are fairly constrained in their layout as per the ISA 5.1 standard. Field instruments are always placed on the left-hand side, while control-panel or control-room instruments must be located on the right-hand side. Text describing instrument tags, ranges, and notes are always placed on the bottom.
Unlike PFDs and P&IDs where component layout is largely left to the whim of the designer drawing the diagram, loop sheets offer little room for creativity. This is intentional, as creativity and readability are mutually exclusive in cases where there is an immense amount of technical detail embedded in a diagram. It is simply easier to find details you’re looking for when you know exactly where they ought to be.
An interesting detail seen on this loop diagram is an entry specifying “input calibration” and “output calibration” for each and every instrument in the system. This is actually a very important concept to keep in mind when troubleshooting a complex instrumentation system: every instrument has at least one input and at least one output, with some sort of mathematical relationship between the two.
Diagnosing where a problem lies within a measurement or control system often means testing various instruments to see if their output responses appropriately match their input conditions, so it is important to document these input and output ranges.
For example, one way to test the flow transmitter in this system would be to subject it to a number of different pressures within its range (specified in the diagram as 0 to 100 inches of water column differential) and seeing whether or not the current signal output by the transmitter was consistently proportional to the applied pressure (e.g. 4 mA at 0 inches pressure, 20 mA at 100 inches pressure, 12 mA at 50 inches pressure, etc.).
Given the fact that a calibration error or malfunction in any one of these instruments can cause a problem for the control system as a whole, it is nice to know there is a way to determine which instrument is to blame and which instruments are not. This general principle holds true regardless of the instrument’s type or technology.
You can use the same input-versus-output test procedure to verify the proper operation of a pneumatic (3 to 15 PSI) level transmitter or an analog electronic (4 to 20 mA) flow transmitter or a digital (fieldbus) temperature transmitter alike. Each and every instrument has an input and an output, and there is always a predictable (and testable) correlation from one to the other.
Another interesting detail seen on this loop diagram is the direction of action of each instrument. You will notice a box and arrow (pointing either up or down) next to each instrument bubble. An “up” arrow (↑) represents a direct-acting instrument: one whose output signal increases as the input stimulus increases. A “down” arrow (↓) represents a reverse-acting instrument: one whose output signal decreases as the input stimulus increases. All the instruments in this loop are direct-acting with the exception of the pressure differential transmitter PDT-42:
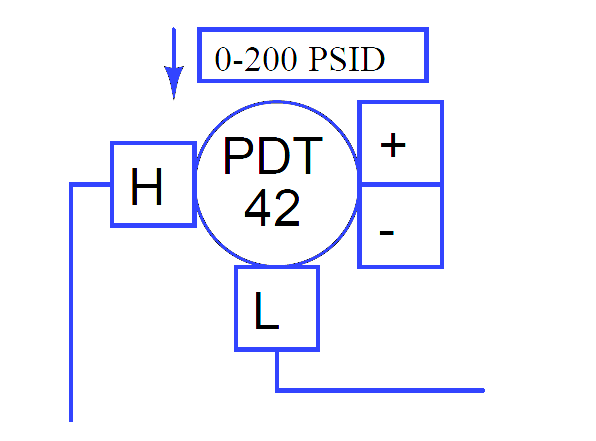
Here, the “down” arrow tells us the transmitter will output a full-range signal (20 mA) when it senses zero differential pressure, and a 0% signal (4 mA) when sensing a full 200 PSI differential. While this calibration may seem confusing and unwarranted, it serves a definite purpose in this particular control system.
Since the transmitter’s current signal decreases as pressure increases, and the controller must be correspondingly configured, a decreasing current signal will be interpreted by the controller as a high differential pressure. If any wire connection fails in the 4-20 mA current loop for that transmitter, the resulting 0 mA signal will be naturally “seen” by the controller as a pressure over-range condition.
Excessive pressure drop across a compressor is considered dangerous because it may lead to the compressor surging. Thus, the controller will naturally take action to prevent surge by commanding the anti-surge control valve to open, because it “thinks” the compressor is about to surge. In other words, the transmitter is intentionally calibrated to be reverse-acting such that any break in the signal wiring will naturally bring the system to its safest condition.
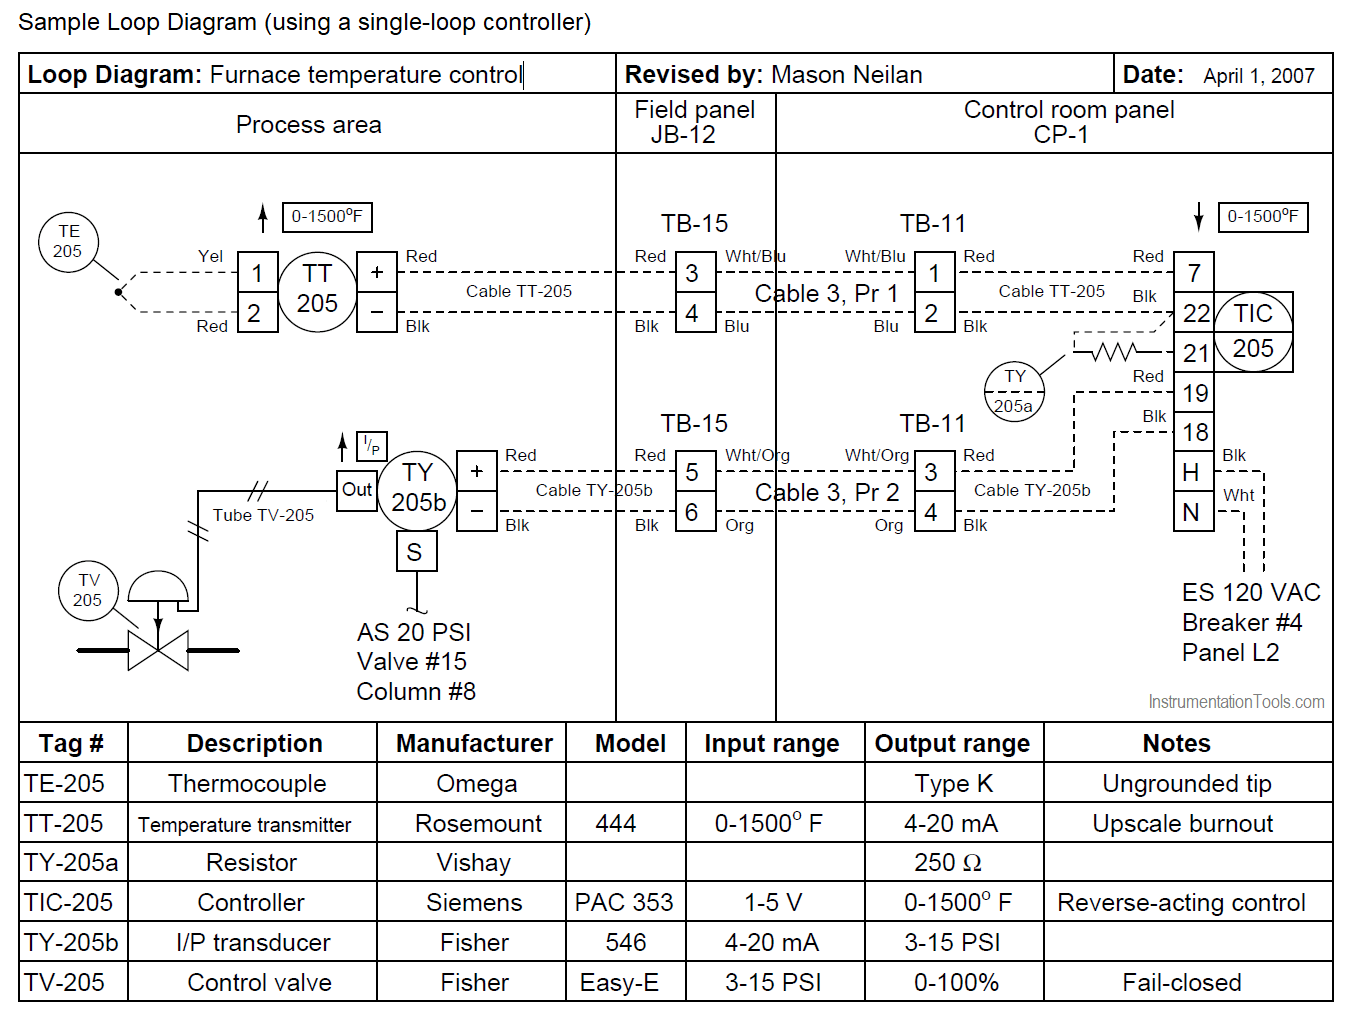
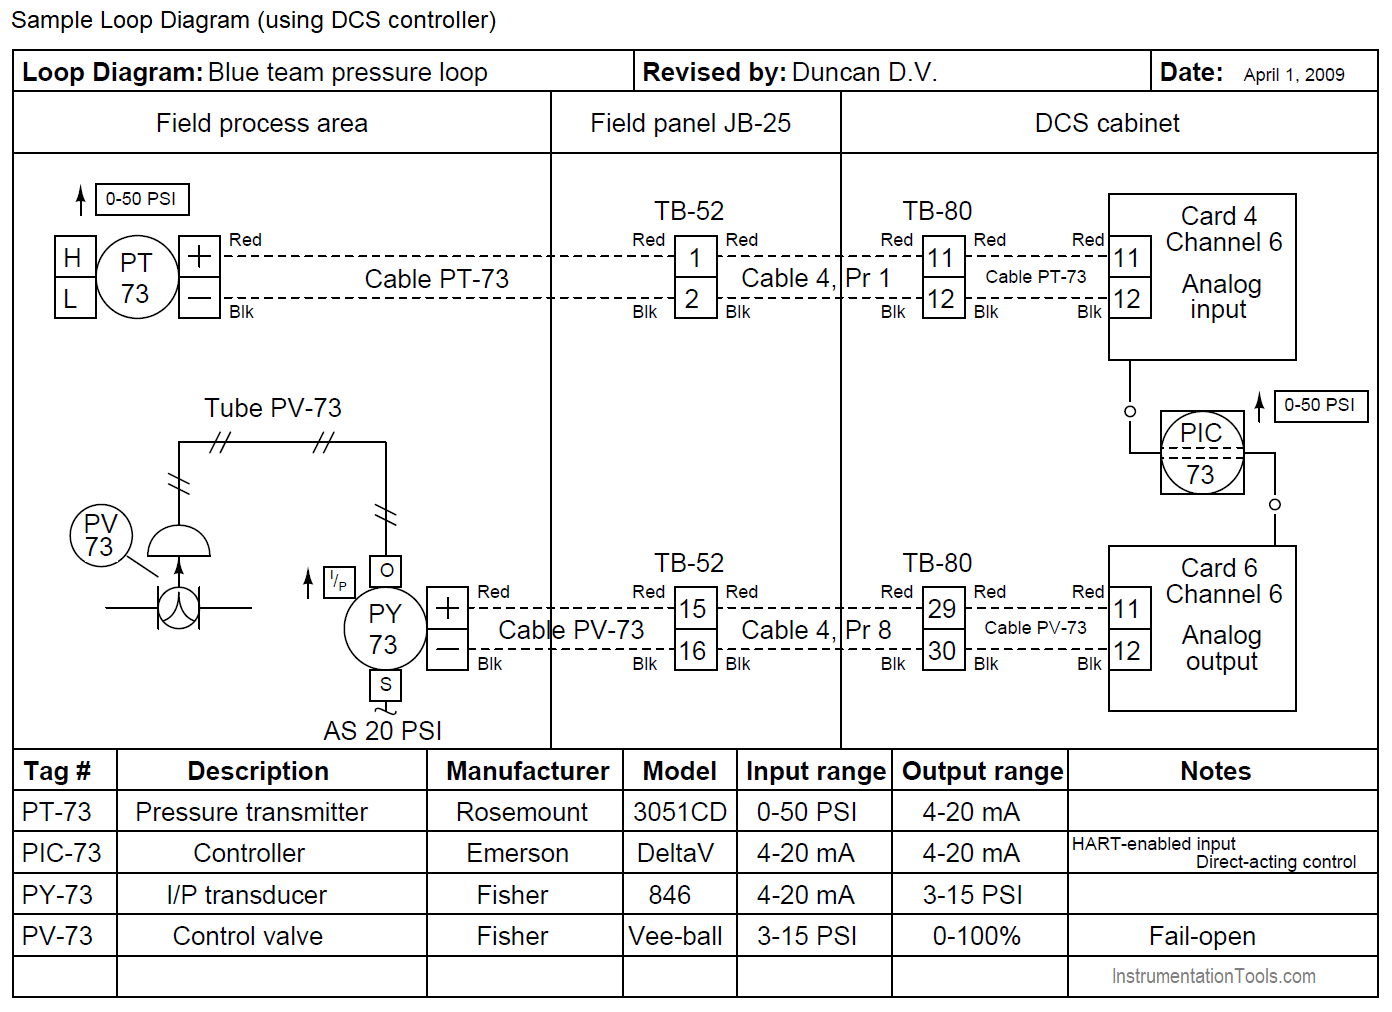
Sample Loop Diagrams
Read Next:
- Instrument Calibration Questions
- 200 Quiz Questions on Instrumentation
- Loop Controller HART Signal Noise
- Level Control using Flow Loop
- As-Found and As-Left in Calibration


THANK YOU FOR SHARING VALUABLE DETAILS ON INSTRUMENTATION
Very good information we got from this aap thanks for your valuable contribution.
El aporte realizado es realmente importante. Muy agradecido
Spanish to English : The contribution made is really important. Very thankful
well written..thank you!
Hi. I would like to know what software or graphics generator is used for creating loop diagrams…
Smart Plant Instrumentation(Intools), Aveva