Designing and construction of an Industrial Process Plant Project is the result of activities and produced documentation by different technical and non-technical teams, among which the Process Team (PR-Team) has the critical role since such team will specify the total activity approaches (targets) of all other teams for satisfying (project) process requirements.
In fact, the documents and activities of the Process Team make some main input data to other teams for starting their jobs. However, during the detailed engineering Design phase of the project, feedback from all other disciplines will have some effects on PROCESS Team activities and requirements and hence on project targets.
Instrumentation and Process Team Interactions
All disciplines will interact with the process team. Safety-Team due to close view to PROCESS Team will have parallel approaches to them and in this regard, in some engineering companies SAFETY-Team activities will be followed by PROCESS Team (see reference article).
Figure-1: PROCESS-Team and I&C-Team have great interactions with each other to reach/make the safe and smooth performance operations of the process plant.
“In general, all process industries have three main elements: equipment, utility generation and networks, and instrumentation/control systems.
The Instrumentation and Control System element works like the nervous system in the human body in that it monitors different locations of the plant and controls their operation.” (Piping and Instrumentation Diagram Development, Book Written By: Moe Toghraei)
Figure 2: Three main elements of all Process Industries
The instrumentation & Control Team (I&C-Team) has the responsibilities for providing process parameters measuring/ monitoring facilities and controlling actions for required functionalities, in order to make process operations reach maximum safety with the best performances.
Hence I&C-Team will have great interactions with the PROCESS Team (and SAFETY-Team) to provide complete project requirements (especially for safe and smooth performance). We will try to review some of such main interactions. It shall be noted that although the title of this article is I&C and PROCESS Teams interactions, in fact, it includes some SAFETY-Team interactions too.
I&C and PROCESS Teams Interaction Model
Details of the I&C and PROCESS Teams’ roles and responsibilities can be found in separate articles (mentioned in references), but based on such articles, Figure 3 can show a model for the main interactions between these two teams.
Figure 3: I&C and Process Teams Interactions Model (In Detail Design Engineering Companies).
As it is clear from Figure 3, the proposed model shows the main activities of both I&C and PROCESS Teams, while the main faces of required interactions are shown as flashes between two against sides. This model defines the general duty/responsibility title for I&C-Team as “Control & Safety Systems + Instrumentations + Automation Functions & Facilities” and for PROCESS Team-as “Process Plant (Equipment) Requirements & Safety + Functional Operations”, and by considering these two general titles the main activity blocks of both teams are arranged accordingly.
Figure 4 shows another interpretation of the activities of the two mentioned teams which are provided based on the detailed activity model of I&C Roles & Responsibilities (Documentations) in the referenced article. It also shows some interactions between I&C and PROCESS Teams, but in this figure, we can understand the sequence of activities during project execution too.
Figure-4: Activity (Sequence) Model of Process Team Interactions with I&C-Team Roles & Documentations (in detail Design Engineering Companies).
In the following study, we make Figure 3 a reference for considering the title of interactions, while whenever required reader can refer to Figure 4 for a better understanding of the sequence of activities related to interactions.
Process Plant Project Inputs for both Instrument and Process Teams
At the beginning of the Detail Engineering Design Phase of the Process Plant Project, both instrumentation and process teams will receive the project input data as the basis of their following activities and documentation. These inputs may include many (but not limited to) items like Customer/ User Requirements (Contract, Basic Package, …), Design Basis, Standards/ Codes/ Governmental Rules, Business Requirements, Company Procedures/ Practices, Vendor List/ Available Technologies, Stockholders Concern,…etc.
Both teams shall review the relevant items from Project Inputs, while both teams shall get the core concepts in order to have close coordination for drawing the overview of the required Process Plant Design Basis/ Process Plant Control Philosophy. Of course, such subjects will then be completed with more details due to other activities and documentation.
Process Plant Design Basis
As mentioned, the Process team based on project inputs shall specify and draw the overall project requirements targets which appear as the Process Plant Design Basis. Accordingly, the instrumentation Team shall coordinate with the Process Team to specify all project control and safety systems requirements that appear as the Process Plant Control Philosophy.
It is clear that at the beginning of the project, the outputs of both teams appeared as primary and will be completed during detail design by finding some more details of project requirements. During the execution of the Detail Engineering Design of the project, both teams (Process and I&C) shall have close coordination regarding process plant control (systems) requirements. Furthermore, the Instrumentation Team issues General Specification Documents (especially for project-required instruments).
However, both teams based on their found results shall coordinate with other disciplines accordingly. One of the more important coordination (for both teams) at the beginning of the project is related to Plant Layout/ Project Areas (including Boundaries/ Limitations/ Locations) with the PIPING team of the project.
Block and Process Flow Diagrams (BFD/ PFD)
By such diagrams, Process-Team makes a General Overview of the Project Process Plant for main equipment/ packages and material routes further to define process function units. I&C-Team like other teams uses such diagrams for understanding the overview of the project plant and accordingly to define/ assign a primary range of required tag numbers.
However such documents are a very good basis for providing the Plant General Overview sheet at the beginning of the set of HMI Graphic Displays.
Figure-5: Sample of Block Flow Diagram (Plant Overview)- Provided by Process Team.
Figure 5 shows a sample of the Block Flow Diagram (Plant Overview) which is provided by Process Team. Due to the project process size (and complexity), such a document may have several sheets to better clarify the Project Plant Overview. As it is clear from Figure 5 the main required equipment/ packages are specified.
Plant Overview Graphics
Figure-6 is a sample of the provided graphic display sheet for Plant Overview which is provided by using the Process Team document (Figure-5) in two modes: a) Static and b) Dynamic.
Static Mode of the provided sheet shows the provided drawing picture for plant overview of equipment/ packages and process units, while Dynamic Mode shows the real (actual) situation of such graphic display sheet by color changing of equipment/ packages by their real actual situations.
Square blocks in the Plant Overview sheet are dynamic (active) blocks, whereby the operator clicks on them, the current HMI graphic page will be transferred to the requested process unit (first sheet). Also, we can see that the provided HMI Graphic page was produced by merging some sheets of BFD document.
Figure-6: Sample of Provided Graphic Page of Plant Overview:
a) Static b) Dynamic.
Developing P&ID’s
(This section is prepared via some extraction from the Piping and Instrumentation Diagram Development book, First Edition. Moe Toghraei. © 2019 John Wiley & Sons, Inc. Published 2019 by John Wiley & Sons, Inc. Companion website: www.wiley.com/go/Toghraei_PID)
P&ID usually is used as an abbreviation of “Piping & Instrument Diagram” while by some it is used as “Process & Interlock Diagram”. Mostly the first one is used.
Regardless of the meaning of the used abbreviation, P&ID is a type of engineering drawing that describes all the process steps of a process plant (see Figure 7).
The piping and instrumentation diagram (P&ID) which is the output document from the PROCESS Team, is what might be considered the bible of a chemical process plant (CPI). It provides a lot of information for the manufacturing of the equipment, installation, commissioning, start‐up, and operation of a plant. It also presents how a process plant should handle emergency situations.
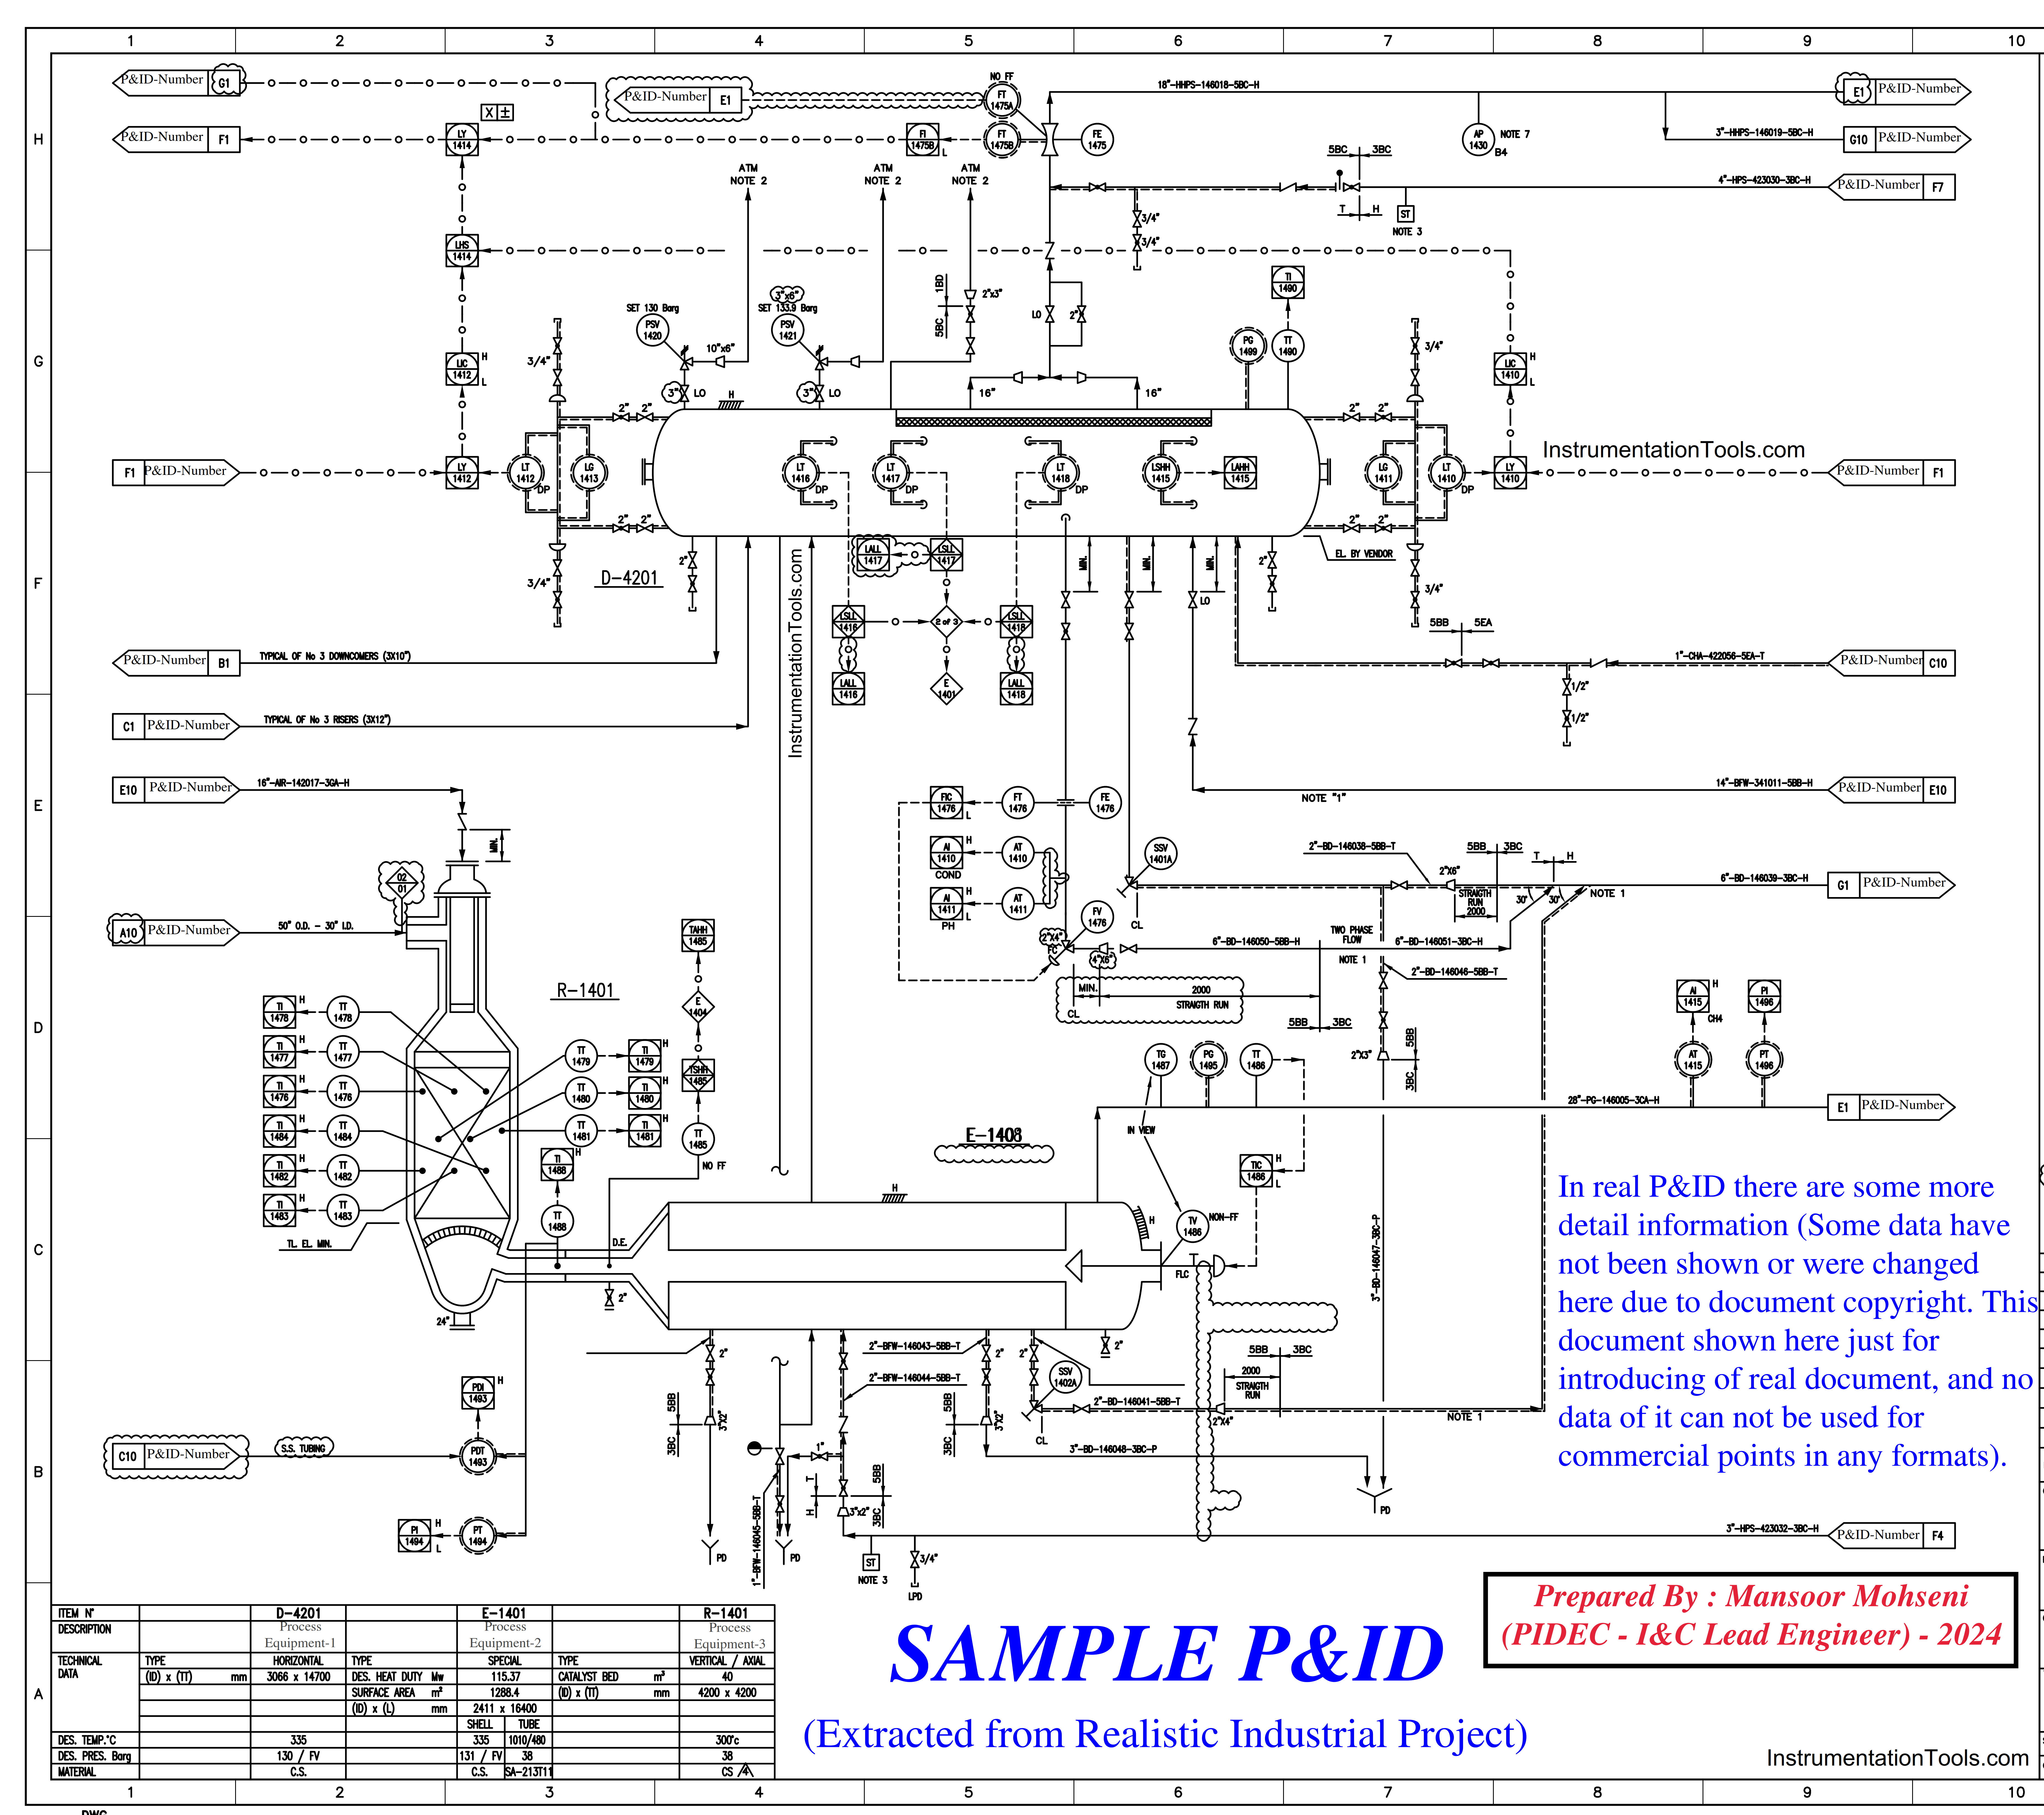
Figure 7: Sample of P&ID provided by PROCESS-Team (extracted from the realistic project).
The P&ID is a frequently referenced document throughout a project term – from the designing stages to the plant‐in‐operation phase – by various engineering disciplines, in technical meetings with vendors or manufacturers, hazard and operability study (HAZOP) meetings, management meetings, and project scheduling and planning. It is also one of the few documents created by multiple engineering groups such as Process, Instrumentation and Control (I&C), Plot plant and Piping (PL&P), Mechanical, Heat Ventilation and Air Conditioning (HVAC), and to a lesser extent Civil, Structural, and Architecture (CSA) and environmental or regulatory groups.
The information provided by the P&ID allows for the generation of other documents, including piping isometric drawings, the piping model, equipment and instrument lists, cause‐and‐effect diagrams, control philosophy, alarm set‐point tables, line designation table (LDT) or line list, material take‐offs, loop diagrams, tie‐in lists, and many more. The P&ID can ironically be considered an acronym for “primary inter-disciplinary document.”
All the above-mentioned groups involved in a process plant should be familiar with P&IDs to some extent. P&IDs can be considered the source document to prepare “shopping lists” for piping, mechanical, and I&C requirements.
Process and I&C groups should be fully knowledgeable about P&IDs because they are the main developers of P&IDs, together with Mechanical and Electrical groups who can also provide some input during development such as the equipment list from mechanical engineers and motor list and electrical classification list from electrical engineers. Instrumentation practitioners should be familiar with the P&IDs because from it they develop their instrument list, I/O list (a document listing instrumentation that serves as an input or output of the control system), and so on.
The Piping group should be familiar with P&ID because it is their main working document and they need this to develop their piping model and piping isometric drawings. Civil engineers should also know P&IDs, although to a lesser extent. However, if the materials are concrete, like in large wastewater treatment plants, they should be familiar with P&IDs.
In HAZOP meetings, the discussion is mainly on P&IDs and about different potential hazards in a designed plant and the required safeguards.
Developing P&IDs and Instrument and Control Team
The Instrument and Control Team shall have close coordination with the Process Team on specifying Instruments/Signals Tag Numbers & Types, and also (Safety/ Logic Control) Interlock Numbers, further to specifying the exact destination of signals (Local Panel, DCS, ESD, PLC, Package Control Panel …).
However, the Instrumentation Team shall help the process Team for identification of the required motor control philosophy for each motor (by EL-Team) and hence required signal interfaces with MCC Panels (or with Package Control Panels).
The instrument Index file as a database of all instruments and signals is the core activity (document) of the Instrumentation & Control Team which is the basis of all other I&C-Team activities and documentation and is filled mainly with information and data from P&ID documents.
Also due to close coordination with the Process Team destination of all signals shown on P&IDs, and the considered role of each signal (Monitoring, Control Loop, Safety/ Trip Loop) shall be finalized and reflected in the Instrument Index too.
The instrumentation & Control Team further purchasing Instruments and Safety/ Control Systems shall assist vendors with exact (right) configurations and arrangements. One of the main outputs of such supervision is HMI Graphic Displays which are provided based on P&ID documents.
In fact, I&C-Team with the help of the Process Team will guide system vendors up to reaching the best arrangement and operator facilities on HMI consoles. Figure-8 shows one sample realistic HMI Graphic Display which is provided based on the P&ID document (shown in Figure-7).
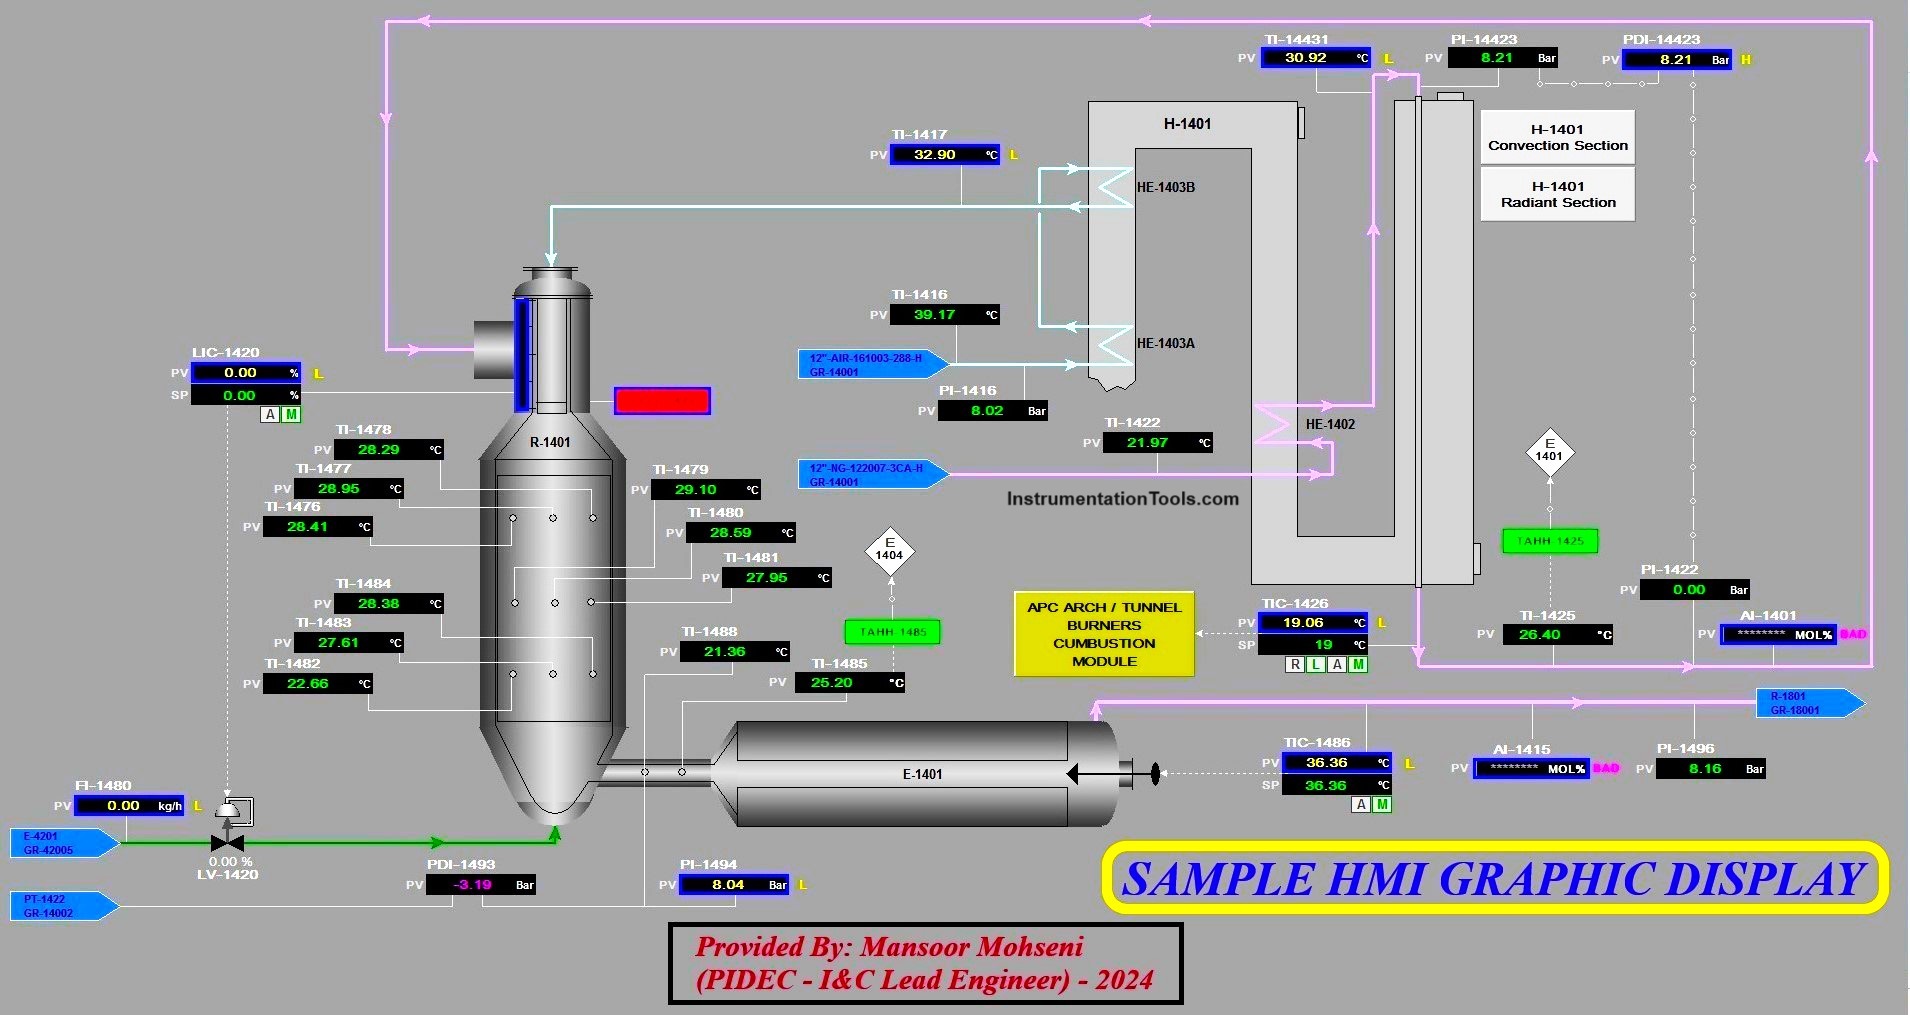
Figure-8: Sample HMI Graphic Display (provided by using Figure-7 P&ID).
As we may conclude from Figure-8, the best arrangement of each HMI Graphic Display will be reached by some partial selection of items or even merging some items and routes on different P&IDs. The best HMI Graphic Display performance will be reached by more close coordination between Process and InstrumentationTeams.
Providing Plant Data by Process Team
Process Team from the beginning of the project and during the detail design engineering via suitable process simulation and making calculations and more detail study for validity shall provide all Process Data which may be used by different disciplines including I&C-Team.
All Process Data sections of Instruments and Valves Datasheets shall be filled by the Process Team for valid update values. In some companies, such data are extracted by I&C-Team from PROCESS-Team documents, while by this routine the possibility of making an error or fault data, especially for updated changed values will be increased. Nowadays Detail Design Engineering Companies use some application software for automatically filling data from Process Team documents into the Instrument Datasheets (will be described more in the following).
Figures 9 and 10 show two samples of Instruments and Valves Datasheets which are I&C-Team documents, but shall be filled (partially) via some Process Data.
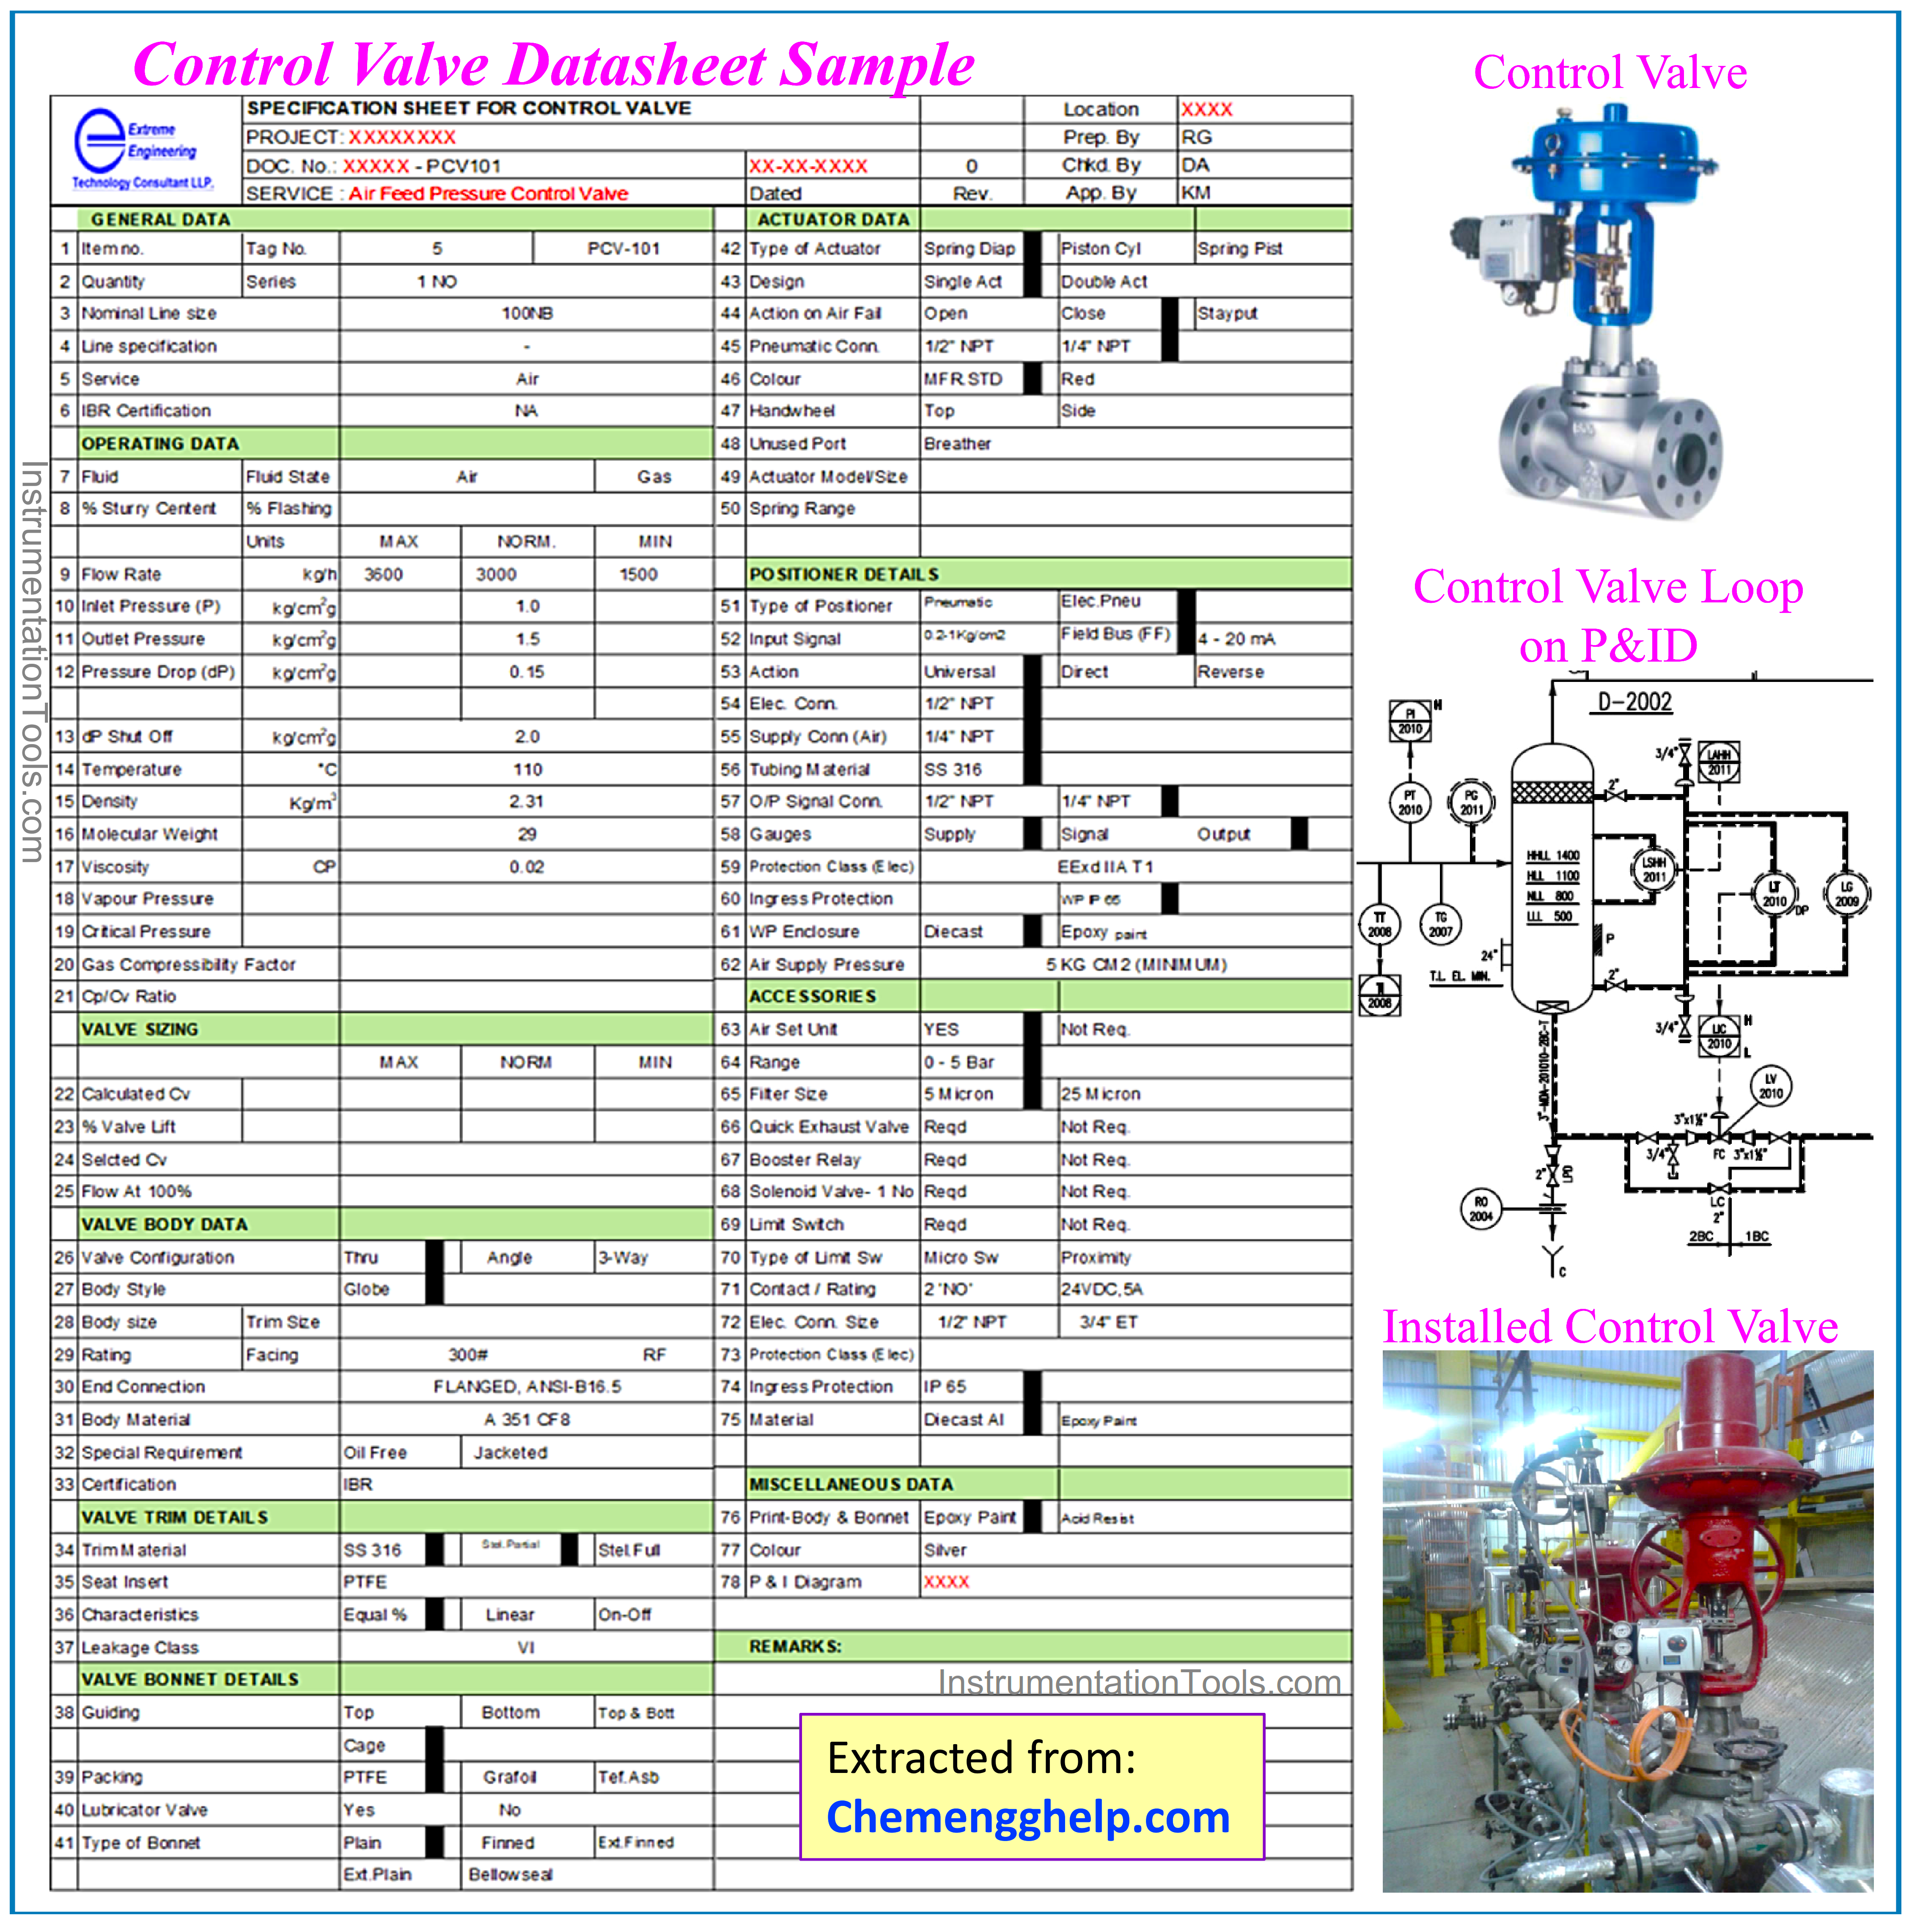
Figure-9: Sample of Control Valve Datasheet as I&C-Team Output Document but shall be filled partially via some Process Data.
Instruments and Valves Datasheets in addition to the provided relevant General Specifications are the core documents for purchasing required project items by Instrument Team. Of course, during the purchasing cycle, some vendors’ technical queries or proposed options need the Process Team’s help to provide more data or validate the proposed options.
However, during the finalization of Purchase Requisitions of Instruments and Valves Items, coordination (interactions) of Process and Instrument Teams may need the help of other disciplines like PIPING, SAFETY, Mechanic, or Rotating Machinery Teams too. Such coordination (interactions) may be more critical for items inside packages (for instruments and valves).
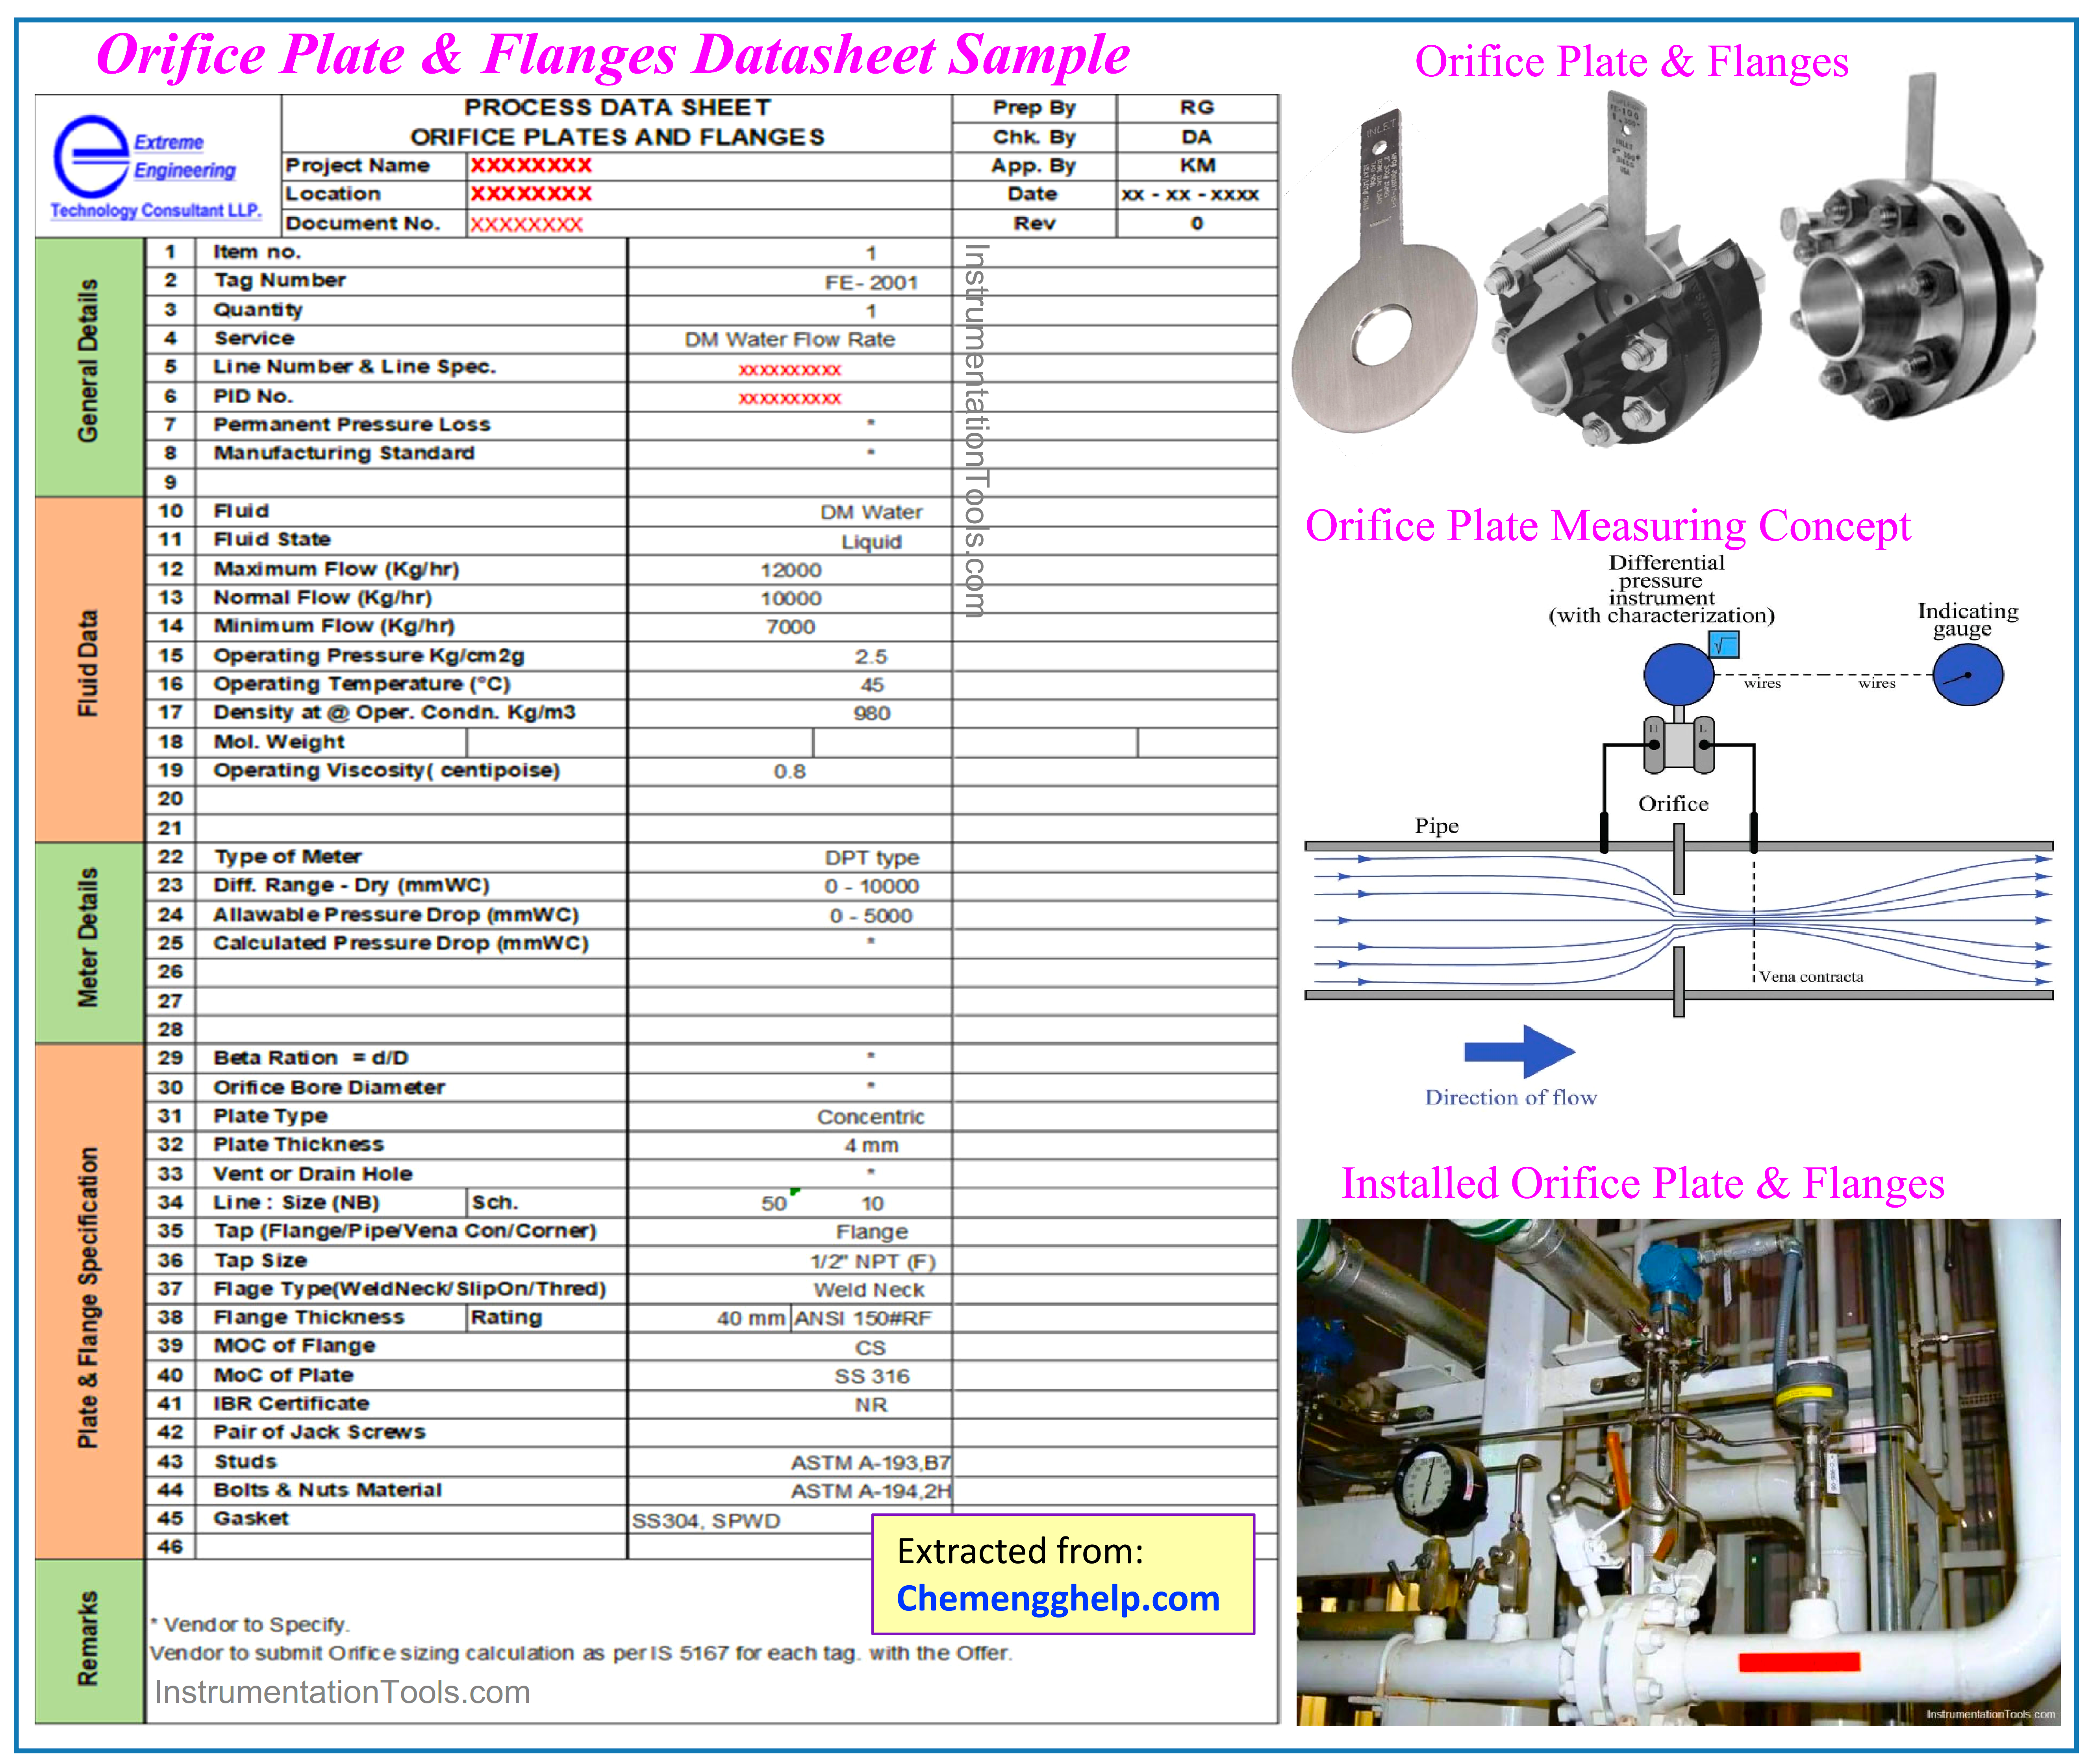
Figure-10: Sample of Orifice Plate & Flanges Datasheet as I&C-Team Output Document but shall be filled partially via some Process Data.
Safety and Control Functional Requirements
The process Team by a detailed engineering study of project requirements shall specify Safety/ Control Functional Requirements by reflecting the required considerations inside documents such as: Process/ Logic Descriptions, Cause & Effects (Matrix) Diagram, Alarm Set-point List, Standard Operation Manuals, etc.
Alarm Set-point List is a document in which, all required/ applicable alarm levels of signals (LLL, LL, L, H, HH, and HHH) shall be specified. However, the range of signals and the unit of measurement also shall be specified in order to have a better sense for users. Such document will be reflected in INSTRUMENT INDEX, but it (as a complementary document) will be transferred to Safety/ Control System vendors by the I&C-Team for implementation in their systems.
Figure 11 shows a sample of the Alarm Set-point List which is provided for a realistic project. In such a project since the LLL and HHH Level Alarms have existed for very limited items, such values were mentioned in the Remark Column.
Figure-11: Sample of Alarm Set-point List document provided by PROCESS-Team in a realistic project.
Cause & Effects (Matrix) Diagram
The process Team for clarifying the exact required (Trip/ Interlock) actions on some levels of critical signals, shall provide some documents for transferring to the instrument team. Furthermore, such a document will summarize the mentioned actions for process operators to quickly check the right performance of the Process Plant. Usually, the best form of transferring such requirements is using the Matrix Diagram.
“The Cause-and-Effects Matrix was originally derived from Safety Analysis Function Evaluation (SAFE) Charts in API RP 14C for offshore facilities for documenting safety requirements. It is an easy way for those familiar with the equipment and operations to understand the logic being implemented in the safety system.
A Cause and Effects Matrix identifies the possible causes (or deviations), listed in rows down the left side of the matrix. The system responses and their resulting effects are listed in columns across the top. The intersection cell in the matrix defines the relationship between the cause and the effect and aids in understanding the system safety control logic. ” (“Guidance Notes On Failure Mode and Effects Analysis (FMEA) for Classification” /American Bureau of Shipping (ABS)- May 2015).
Figures 12 and 13 show two usual formats of Cause & Effects Matrix Diagrams in Industrial Process Plant Projects.
Figure-12: Sample of the usual format for Cause & Effects Diagram in Industrial Process Plant Projects.
Figure-13: Another sample of the usual format for Cause & Effects Diagram in Industrial Process Plant Projects.
It shall be mentioned that the Cause & Effects Diagram in other Industrial Projects (other than Process Plants) has a different format and will be used in different ways. In such industries, the Cause & Effects Diagram usually is the equivalent name for the Fishbone Diagram/ Ishikawa Diagram which is used as a study of each effect from 5 or 6 different possible causes. Figure 14 shows the differences between the Cause & Effects Diagram which is used in Process Industries and Non-Process Industries.
Figure-14: Differences between Process Plant Cause & Effects Diagram with Fishbone/ Ishikawa Diagram used in Non-Process Industries.
Control Loops, Logics, and Interlocks
As mentioned I&C-Team based on the mentioned documents for Safety/ Control Functional Requirements (which shall be produced by the Process Team), will follow to implement suitable Control Loops, Logics, and Interlocks inside Control and Safety Systems.
However, during the preparation of documents for Safety/ Control Functional Requirements by the Process Team, the Instrumentation Team shall check the validity of the mentioned requirements (comparing mentioned conditions in different documents) or may add Tag numbers or Interlock Numbers to such documents.
Process Hazard Analysis
Process Hazard Analysis is one of the main activities of PROCESS and SAFETY Teams which shall be done with the assistance of some other specialists among which the Instrument Team is one of them.
Process Hazard Analysis usually includes HAZOP and SIL Study meetings and the Instrumentation Team shall attend such meetings for clarification on the type of control loops and instrument types and available Safety/ Control Systems facilities. For more detail on such activities please refer to the article mentioned in the references.
SIS/ SIF/ SIL Requirements
During Process Safety/ SIL Study meetings, the required level of SIL Values is determined and further to safety notes shall be reflected in Instrument Datasheets which shall be purchased by the Instrument & Control Team.
Furthermore, certified values of PFDs (Probability of Failure on Demand) of purchased instruments shall be gathered for validating and confirming calculations on the requested SIL value.
Supporting Other Technical Teams
Both PROCESS and INSTRUMENT Teams shall assist other technical disciplines in doing their activities and producing documentation, especially for their purchase requisitions and their Packages.
Other Documents and Activities by PROCESS and I&C Teams
Further to the above-studied items, there are some other activities and documentation by each PROCESS and I&C Team themselves, which in some cases they shall have some coordination with each other.
Site Construction/ Commissioning/ Start-Up / Operation
Both PROCESS and I&C Teams shall have close coordination for supporting site activities during Site Construction/ Commissioning/ Start-Up/ Operation. Such consideration may include Site Surveys/ Site assistance, Site Technical Queries Responses/ Clarifications, and Finding solutions/Decision-making for occurred accidents.
Especially during the Start-Up phase they both shall check the validity of implemented functions in Safety/ Control Systems for project requirements and confirm or modify them.
Design Change Notices / Management Of Changes
During doing detailed engineering Phase of the Industrial Process Plant Project, the P&ID documents may be issued with several revisions for major changes, but of course a limited number for such revisions. Since the number of P&ID Diagrams in each Industrial Process plant may be so many, but during issuing sequential revisions, some changes occur on some diagrams, such changes shall be announced by the PROCESS Team to others (including I&C-Team) by Design Change Notices.
Generally, the PROCESS Team shall have an exact Management Of Change routine for informing all responsible teams of any changes which is happening in the Process of the plant.
Simultaneous Data Entry/ Change in all Relevant Documents
As mentioned above, in order to minimize the possibility of errors or faults in transferring Process Data from the PROCESS Team to the INSTRUMENT Team, the best case is to enter such data at I&C-Team documents at the same time PROCESS-Team enters such data (synchronized). By such a (synchronized) routine, automatically every PROCESS Team change can be monitored by others (I&C-Team).
Nowadays, there are some available software in the world which make such facilities. Figure 15 shows one famous sample.
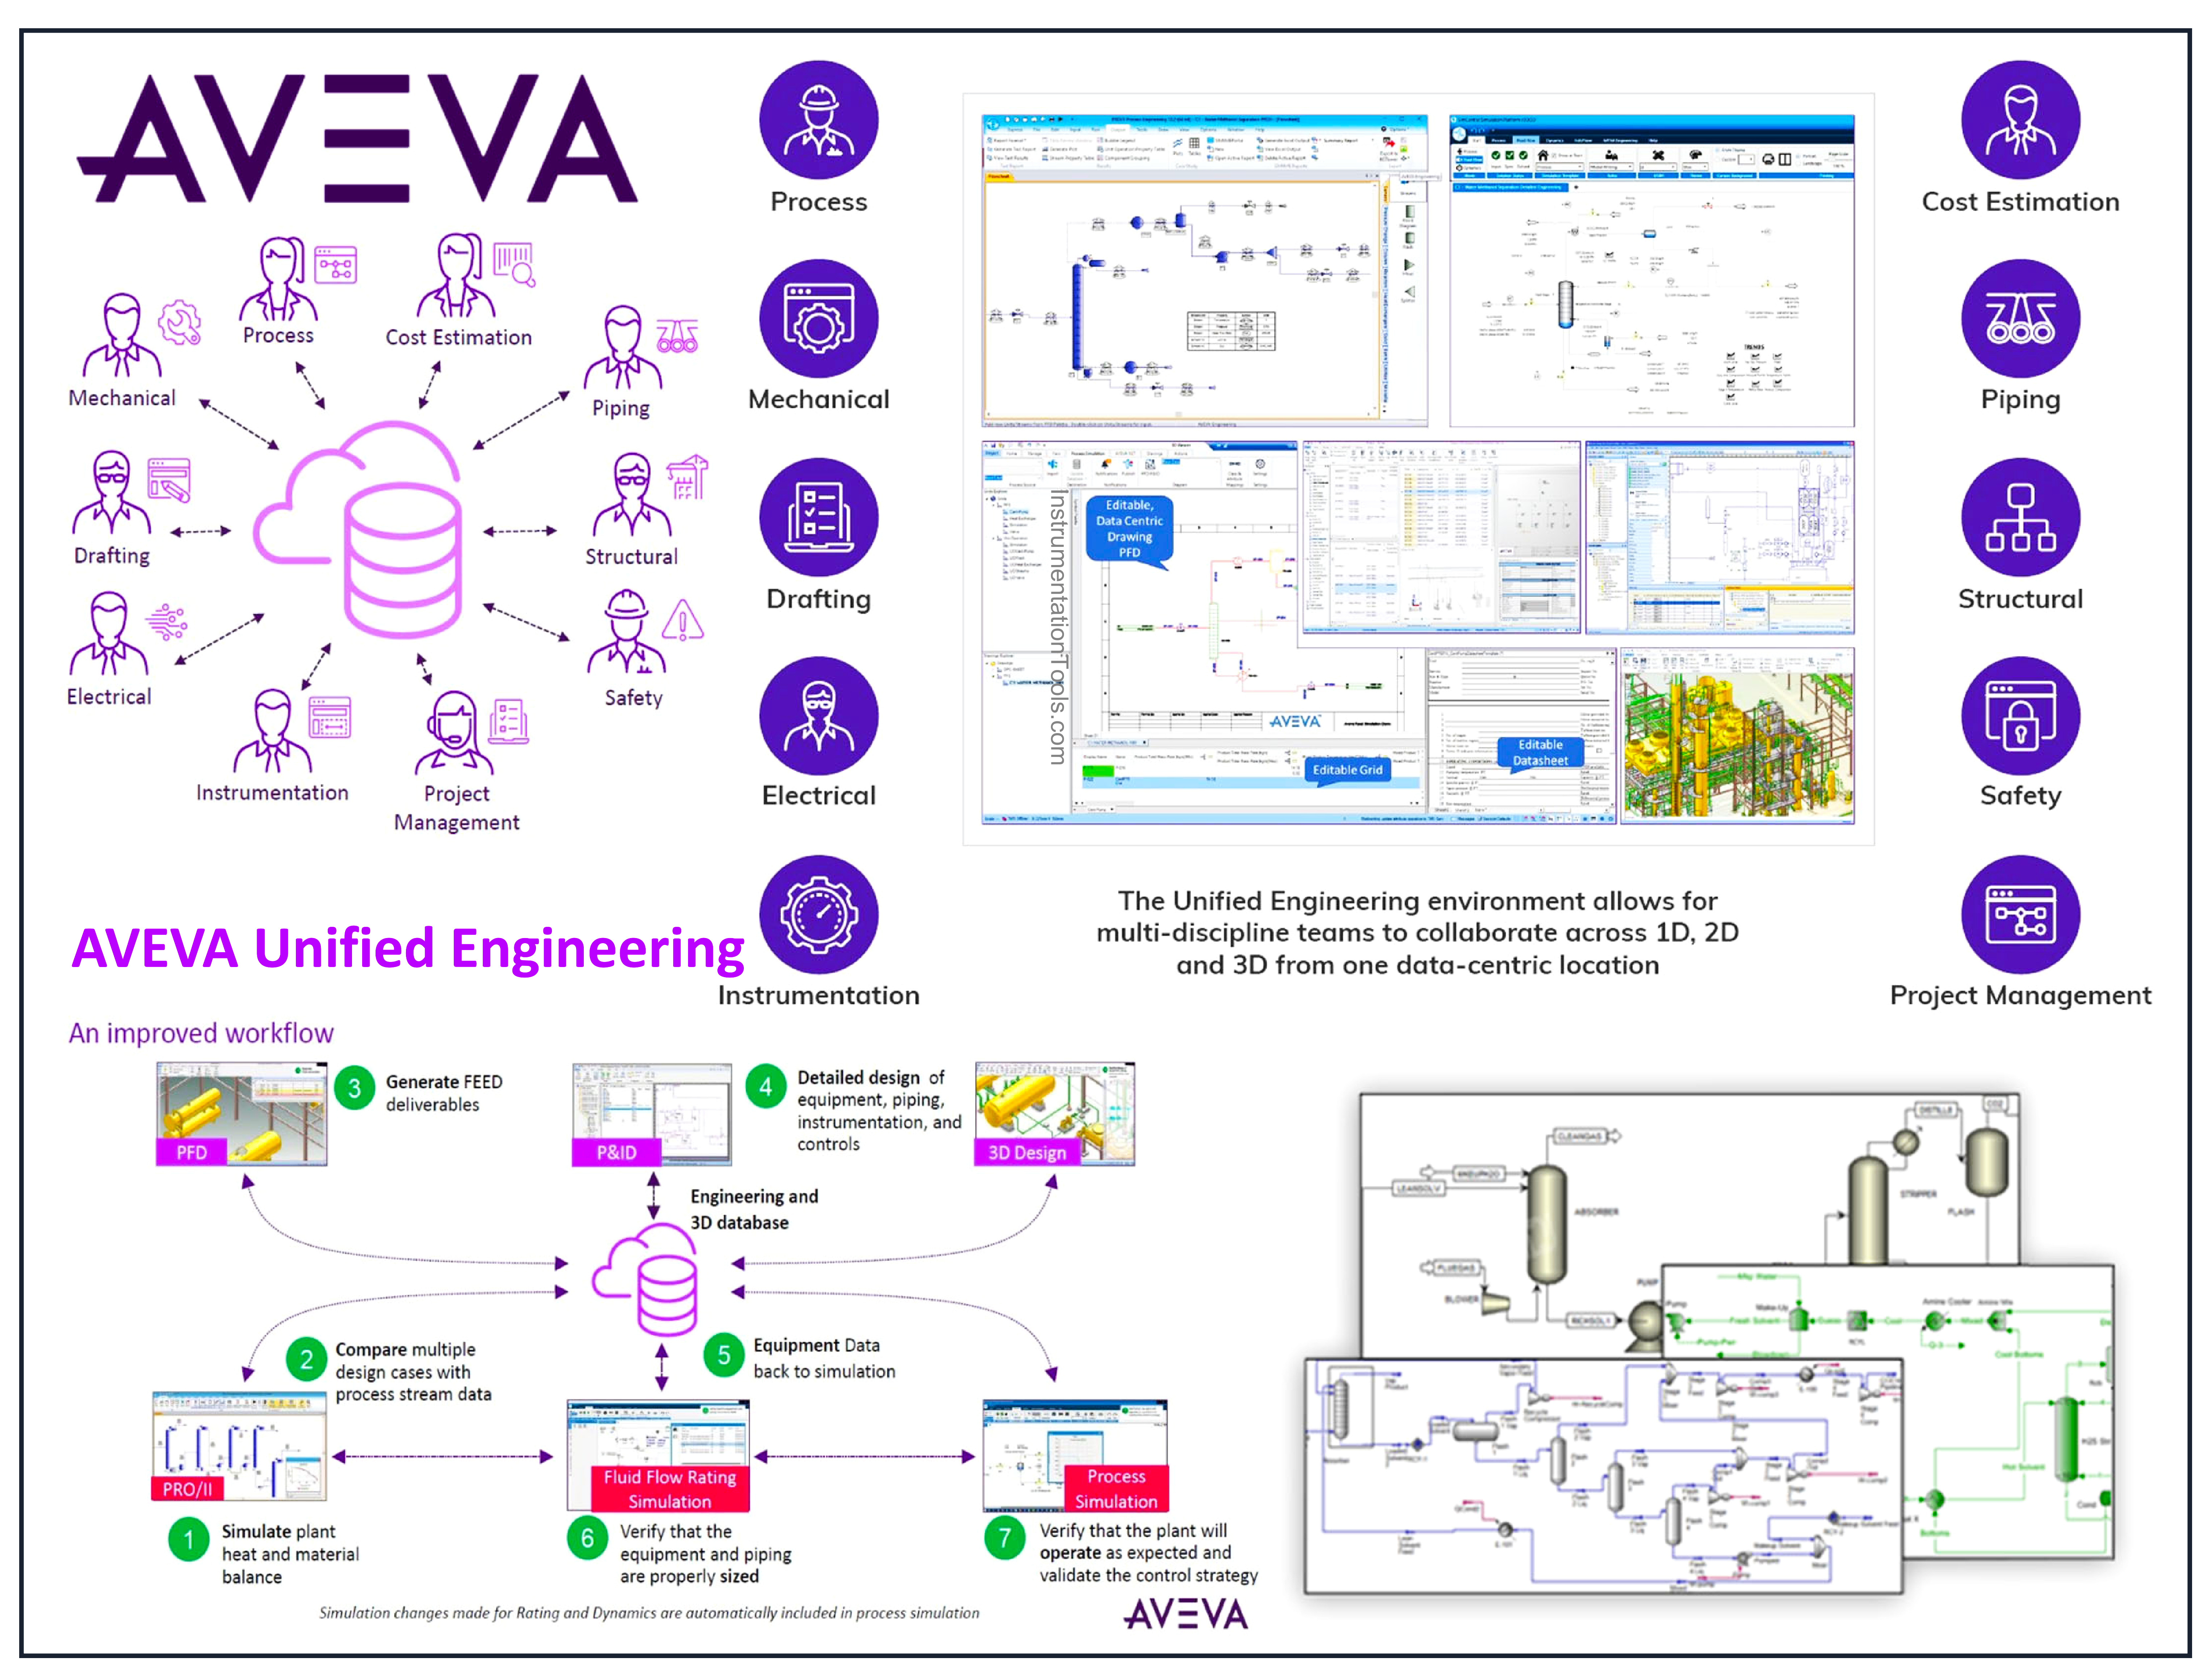
Figure 15: AVEVA has one of the famous software for entering synchronized data by sharing environment facilities (for Detail Engineering Companies).
References:
- Process engineering roles & responsibilities
- Safety roles & responsibilities of process engineering (process safety team)
- I&C Engineer Roles & Responsibilities – Instrumentation Design
- Instrumentation Engineer Activities & Documents – Detail Design Phase