Basically, Process diagrams can be divided into two major categories.
Both PFD and P&ID are chemical /process engineering drawings and piping diagrams.
The process flow diagram is also known as “flow sheet” is the first document that enables a clear understanding of the process to be controlled. It shows only the major equipment without details.
That means it shows the crucial elements of the process such as pumps, vessels, turbines, heaters, columns in the system. These, together with the associated material balance, enable a single document to give the control systems engineer a good grasp of the process.
During initial control systems work, the process diagram permits the concepts of process control strategies.
Later, the material balances and operating conditions may be used as input data for the sizing of inline instrumentation such as orifice plates, control valves, and for the selection of their required process instruments such as transmitters, pressure gauges, etc.
The very simplicity of the PFD document allows the control systems engineer to work quickly and logically without being faced with the confusion that is usually associated with more detailed engineering drawings. Despite this simplicity, the process flow diagram carries an enormous amount of information about the process.
In the figure below, PFD symbols on the left side of the table are shown for the pump, tank, and heat exchanger. For the same pump, tank, heat exchanger many types of P&ID symbols can be chosen while drawing a P&ID based on the application.
Typical examples found in the process section could include the heat exchangers, distillation columns, or reactors. The process area is a complex collection of equipment that works together with products that will be sent to the final section.
To control a process, one must understand it. A process whose basic characteristics and responses to disturbances are not known thoroughly, cannot be controlled.
The process flow diagram is essential to document the control systems engineer’s understanding of a given process.
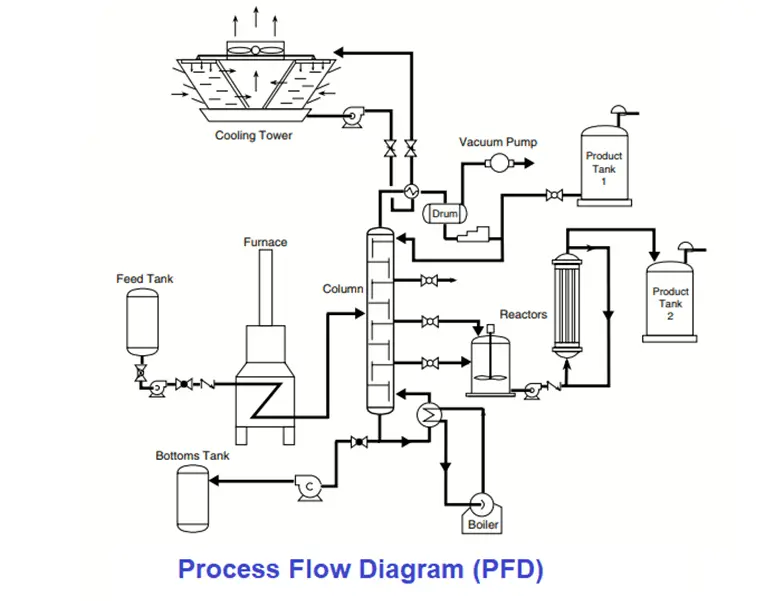
To understand a simple flow diagram if it is broken down into sections such as feed, preheating, the process, and the final products as shown in the Process Flow Diagram (PFD) figure.
This simple left-to-right approach allows a technician to identify where the process starts and where it will end finally.
The feed section includes the (process) feed tanks, mixers, piping, and valves. In the second step, the process flow is gradually heated for processing connected with steam or hot oil lines. This section includes heat exchangers and furnaces. In the third section, the process is included.
A Piping and Instrument or instrumentation drawing (P&ID) comprises more details than a PFD. It is developed based on information from process flow diagrams, which is developed based on a Block flow Diagram.
A P&ID drawing includes both major and minor details of the process plant.
It displays all major equipment like tanks, heat exchangers, pumps, piping details, and also instrumentation details like all pressure temperature and flow instruments, control valves, pressure safety valves, various meters, and tapping details.
P&ID is a detailed form of PFD. Process engineers, in coordination with piping, instrumentation, electrical, and safety engineers are responsible for preparing the P&IDs.
P&ID drawing has more importance as the basic document for piping engineers for the purpose of material procurement and deciding of pipe routing.
The table below shows how do details of a “Tank” are represented in PFD and P&ID.
A P&ID (Piping & Instrument Drawing) is a complex reproduction of the various units found in a plant. It is used by people in various departments of the plant.
The primary users of the document after plant startup are process engineers, operators, and instrument and electrical, mechanical, safety, and engineering personnel.
In order to read a P&ID, the technician required an understanding of the equipment, instrumentation, and technology.
Reference: Piping and Instrumentation diagram Development by Moe Toghrael.
If you liked this article, then please subscribe to our YouTube Channel for Instrumentation, Electrical, PLC, and SCADA video tutorials.
You can also follow us on Facebook and Twitter to receive daily updates.
Read Next:
VFD simulator download: Master the online tool from the Yaskawa V1000 & programming software for…
The conveyor sorting machine is widely used in the packing industries using the PLC program…
Learn the example of flip-flop PLC program for lamps application using the ladder logic to…
In this article, you will learn the STAR DELTA programming using PLC controller to start…
Lube oil consoles of rotary equipment packages in industrial process plants are usually equipped with…
Rotating equipment packages such as pumps, compressors, turbines need the lube oil consoles for their…


View Comments
P&ID = Piping and Instrumentation diagram*
Of which industry this p id is?