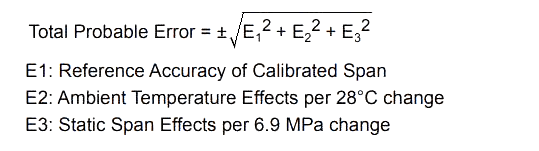
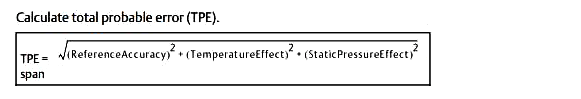
The overall performance of the transmitter is defined by the Total Probable Error (TPE).
TPE is the accuracy of the instrument in installed/actual conditions.
Transmitter Calibration Frequency
TPE is made up of four things:
1. Reference accuracy
This is to be calculated at calibrated Span.
2. Ambient temperature effects
Transmitters are factory calibrated at room temperature. If a transmitter operates at a different ambient temperature, the electronics perform differently, and a measurement error may result.)
3. Line Pressure Effects
Line pressure effect errors occur when diaphragms are altered under static pressure. Normally Manufacturers will define the performance affected due to every 1000 PSIG pressure changes.
There is zero and span effect due to static Line pressure. some vendor claims that zero effect can be eliminated by Zero Trim when it is performed under static pressure condition.
4. Some manufacturer defines Transmitter performance is affected by Overpressure up to 250 bar.
If the performance does not meet the minimum requirements, then the transmitter might not be a good fit for the application.
The below sample calculation performed to arrive Total probable error (0.1%FS) in the transmitter which is around 2.5 times degraded than reference accuracy (0.04% FS).
Another important term, Stability, is a transmitter’s change in output given at fixed input as a function of time. Better long-term stability results in the reduction of periodic Calibration /maintenance and repairs, which leads to the reduced total cost of ownership.
Case study on Transmitter Accuracy and its stability which will ultimately guide to required calibration frequency.
The intention of this study is not to demonstrate which brand is better, but to educate the fundamental calculation, transmitter performance, and ultimately calibration frequency.
Example:
We use the below specifications for three different make transmitters to calculate their overall performance and calibration frequency interval.
- Differential Pressure Range: 0-100 inH2O
- Ambient Temperature range: 40 to 90 oF, Delta is 50 oF
- Line Static Pressure: 1000 PSIG
- Acceptable performance: 0.3% of Span
We have to calculate five factors to determine transmitters’ performance, they are.
1. Reference Accuracy of Calibrated Span (E1)
2. Ambient Temperature Effects on Transmitter (E2)
3. Static Pressure Effects (E3)
4. OverPressure Effects (E4)
5. Stability (E5)
So, we have to calculate these five factors for each transmitter make then only we can find their performance.
Yokogawa Transmitter [EJX110A]
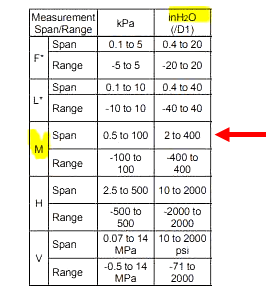
Calibrated Span 100 inH2O
URL is 400 inH2O
Reference Accuracy of Calibrated Span
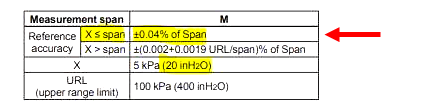
E1 = 0.04*100%
E1 = 0.04 inH2O
Ambient Temperature Effects on Transmitter
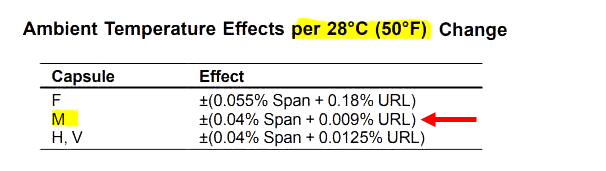
E2 = ± (0.04*100% + 0.009*400%)
E2 = ± 0.076 inH2O
Static Pressure Effects
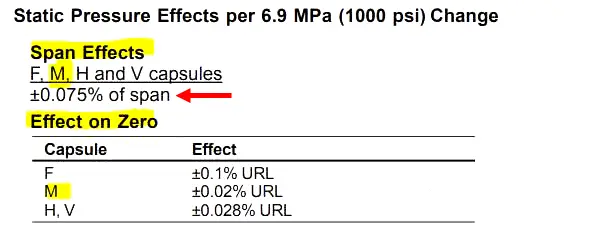
E3 = ± 0.075*100%
E3 = ± 0.075 inH2O
OverPressure Effects
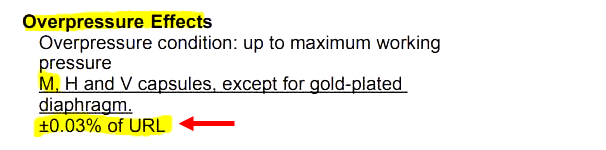
E5 = ± 0.03*400%
E5 = ± 0.12 inH2O
Stability
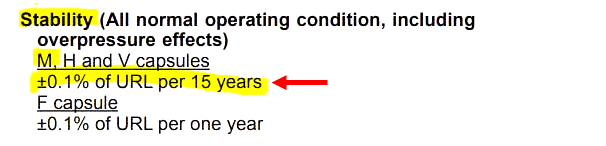
Stability per month = 0.1%*400/(15*12)
Stability per month = ± 0.002222 inH2O
Stability per month = ± 0.002222 %of Span
Total Probable Error (TPE)
TPE = SQRT((0.04)^2+(0.076)^2+(0.075)^2)
TPE = 0.114022 inH2O
TPE = 0.114022 %of Span
Zero Error on static line pressure effect is not included.
Calibration Frequency
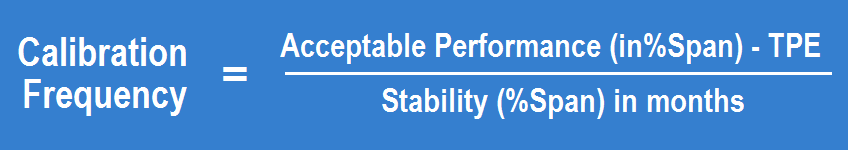
Calibration frequency = (0.3 – 0.114022) / 0.002222
Calibration frequency = 83.69847 Months
Calibration frequency = 6.974872 Years
Total Accuracy
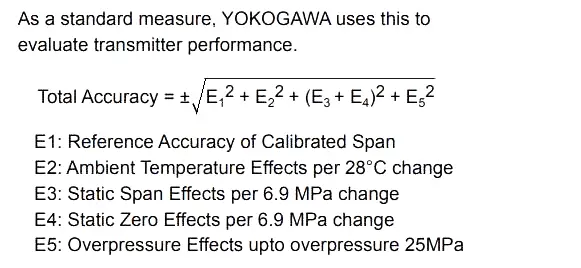
TA = SQRT((0.04)^2+(0.076)^2+(0.075+0.08)^2+(0.12)^2)
TA = 0.214012 inH2O
TA = 0.214012 %of Span
Zero Error on static line pressure effect & Overpressure effects is included.
Similarly, calculate these factors for another two different transmitters.
Emerson Transmitter [3051CD]
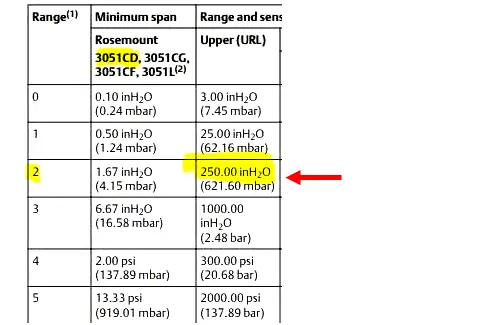
Calibrated Span 100 inH2O
URL is 250 inH2O
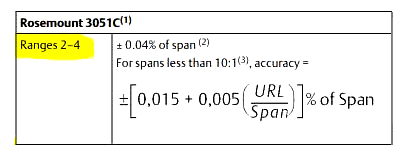
E1 = 0.04 inH2O
E1 = 0.04*100%
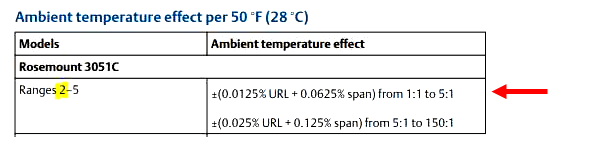
E2 = 0.0125*250% + 0.0625*100%
E2 = 0.09375 inH2O
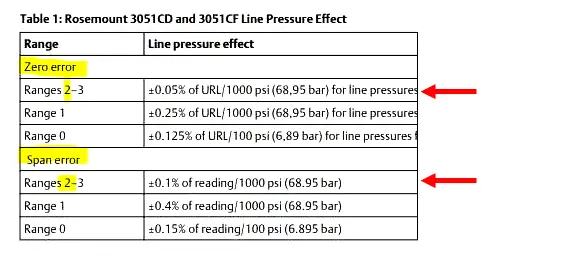
E3 = 0.1*100%
E3 = 0.1 inH2O
E4 = 0.05*250%
E4 = 0.125 inH2O
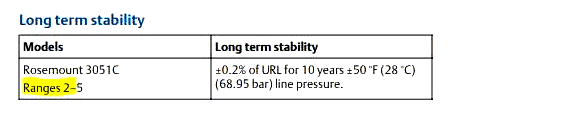
Stability per month = 0.2%*250/(10*12)
Stability per month = 0.004167 inH2O
Stability per month = 0.004167 %of Span
TPE = SQRT((0.04)^2+(0.09375)^2+(0.1)^2)
TPE = 0.14279 inH2O
TPE = 0.14279 %of Span
Zero Error on static line pressure effect is not included.
Calibration frequency = (0.3 – 0.14279) / 0.004167
Calibration frequency = 37.72738 Months
Calibration frequency = 3.143948 Years
There is no data available for an Overpressure effect on Transmitter performance.
3051S model has better accuracy and stability than 3051 Models
Honeywell Transmitter [STD800]
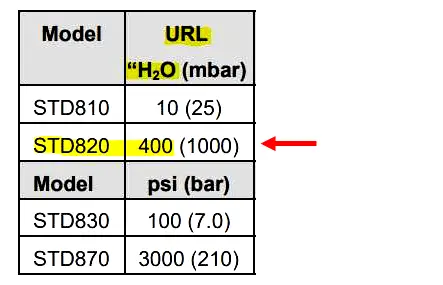
Calibrated Span 100 inH2O
URL is 400 inH2O
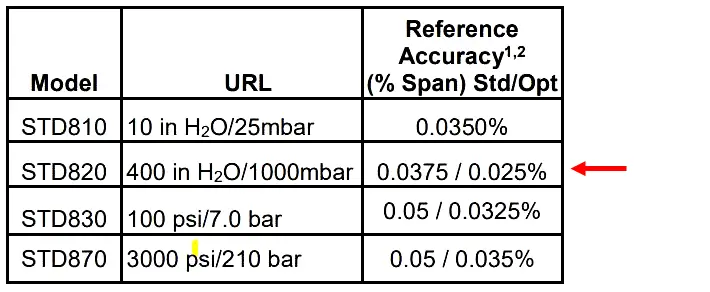
E1 = 0.0375*100%
E1 = 0.0375 inH2O
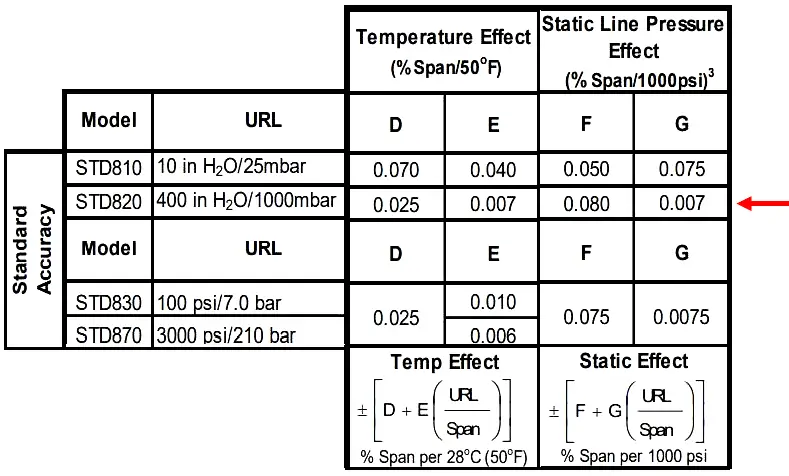
E2 = (0.025 + 0.007(400/100))
E2 = 0.053 inH2O
E3 = (0.08 + 0.007(400/100))
E3 = 0.108 inH2O
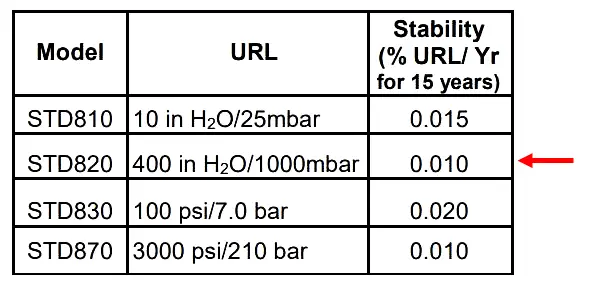
Stability per month = 0.01%*400/(15*12)
Stability per month = 0.000222 inH2O
Stability per month = 0.000222 %of Span

TPE = SQRT((0.0375)^2+(0.053)^2+(0.108)^2)
TPE = 0.126013 inH2O
TPE = 0.126013 %of Span
It seems that Zero Error on static line pressure effect is not included.
Calibration frequency = (0.3 – 0.126) / 0.0002
Calibration frequency = 870 Months
Calibration frequency = 72.5 Years
Recommended frequency 4 Years
There is no data available for Overpressure effect on Transmitter performance
STD700 model has degraded accuracy and stability than STD800 Models
STD700 series model recommended calibration frequency is 2 Years
Conclusion:
We determined the transmitter performance factors for different makes, and we can choose based on the results.
Author: Jatin Katrodiya
Read Next:
- Level Transmitter Design
- Calculate Tolerance of RTD
- Orifice Beta in 0.3 to 0.7?
- Instrument Air Compressor
- Process Variable Damping


Great!