As previously stated, any change in current in a coil (either a rise or a fall) causes a corresponding change of the magnetic flux around the coil. Because the current changes at its maximum rate when it is going through its zero value at 90° (point b on Figure 1) and 270° (point d), the flux change is also the greatest at those times.
Consequently, the self-induced EMF in the coil is at its maximum (or minimum) value at these points, as shown in Figure 1. Because the current is not changing at the point when it is going through its peak value at 0° (point a), 180° (point c), and 360° (point e), the flux change is zero at those times. Therefore, the self-induced EMF in the coil is at its zero value at these points.
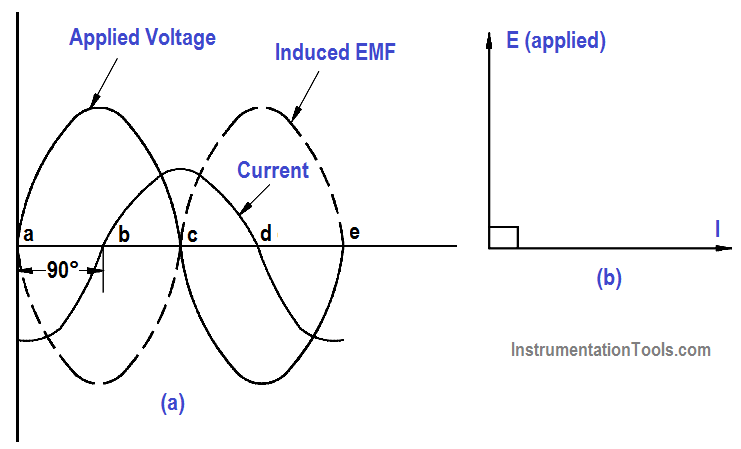
Figure 1 : Current, Self-Induced EMF, and Applied Voltage in an Inductive Circuit
According to Lenz’s Law, the induced voltage always opposes the change in current. Referring to Figure 1, with the current at its maximum negative value (point a), the induced EMF is at a zero value and falling. Thus, when the current rises in a positive direction (point a to point c), the induced EMF is of opposite polarity to the applied voltage and opposes the rise in current.
Notice that as the current passes through its zero value (point b) the induced voltage reaches its maximum negative value. With the current now at its maximum positive value (point c), the induced EMF is at a zero value and rising. As the current is falling toward its zero value at 180° (point c to point d), the induced EMF is of the same polarity as the current and tends to keep the current from falling.
When the current reaches a zero value, the induced EMF is at its maximum positive value. Later, when the current is increasing from zero to its maximum negative value at 360° (point d to point e), the induced voltage is of the opposite polarity as the current and tends to keep the current from increasing in the negative direction. Thus, the induced EMF can be seen to lag the current by 90°.
The value of the self-induced EMF varies as a sine wave and lags the current by 90°, as shown in Figure 1. The applied voltage must be equal and opposite to the self-induced EMF at all times; therefore, the current lags the applied voltage by 90° in a purely inductive circuit.
If the applied voltage (E) is represented by a vector rotating in a counterclockwise direction (Figure 1b), then the current can be expressed as a vector that is lagging the applied voltage by 90°. Diagrams of this type are referred to as phasor diagrams.
Example:
A 0.4 H coil with negligible resistance is connected to a 115V, 60 Hz power source (see Figure 2). Find the inductive reactance of the coil and the current through the circuit. Draw a phasor diagram showing the phase relationship between current and applied voltage.
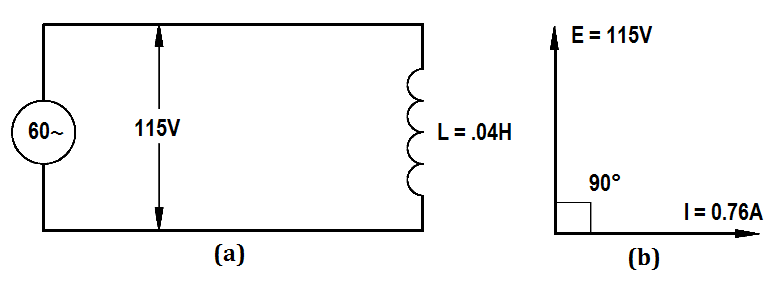
Figure 2 : Coil Circuit and Phasor Diagram
Solution:
1. Inductive reactance of the coil
XL = 2πfL
XL = 2 x 3.14 x 60 x 0.4
XL = 150.7 Ω
2. Current through the circuit
I = 115 / 150.7
I = 0.76 amps
3. Draw a phasor diagram showing the phase relationship between current and applied voltage.
Phasor diagram showing the current lagging voltage by 90° is drawn in Figure 2b.