To Understand Trends, we need to understand how crucial role is the data we’re collecting from the field Instruments plays in an automation system.
Let’s say we are acquiring data from a group of sensors in an automation plant. We can either display it as in values digitally or we can display it in a Graphical chart.
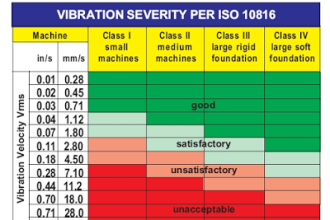
Graphical Chart is one of the most convenient methods to view a group of data for anyone to identify the changes taking place instantly by looking at the waveforms.
Trends
In SCADA graphical display of Data is called Trends.
There are two types of Trends,
- Real-time trends
- Historic trends
Real-time Trends
As the name explains itself, these are the graphs that display the values of data in real-time and the graph updates for every instant of time we have specified.
Now let’s see how to implement in in Intouch SCADA,
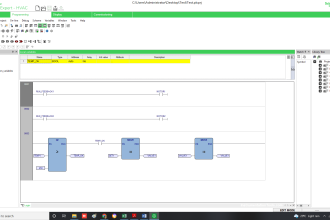
I am using Rslogix500 here and reading data from PLC and displaying it in a graph, For the communication between Intouch and Rslogix500 refer to the article here.
Go to the wizard and take the 16 pen trends from the Trends section and place it on the window.
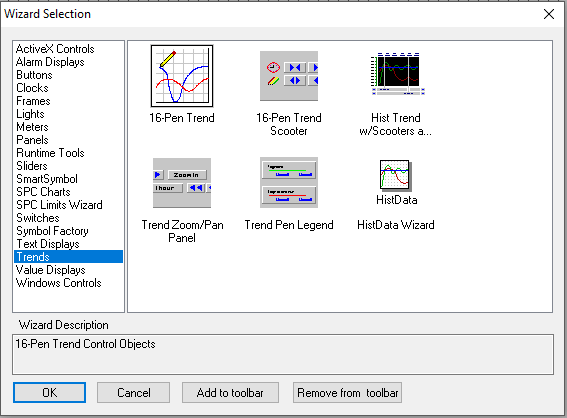
After that click on the object and the screen below opens up.
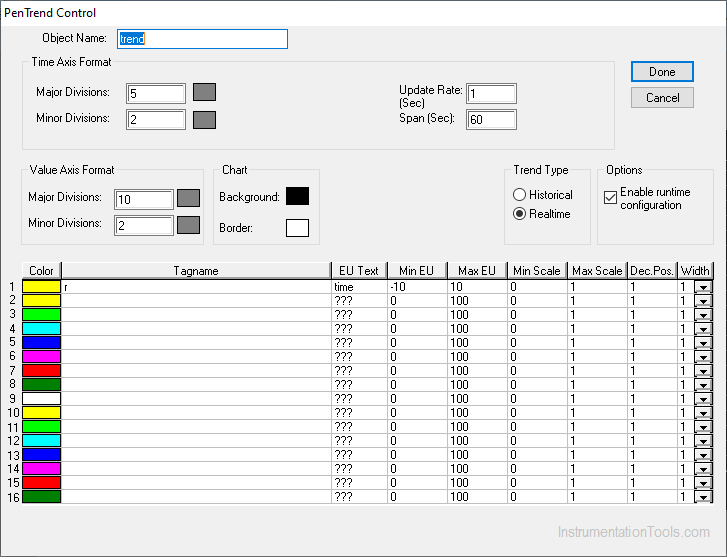
In the tab opened you can modify the update rate in seconds. For the specified time in the update rate, the data will get updated to the graph.
You can also give up to 16 tags in a single trend object. All the waveforms will be displayed in a single graph.
You can also give a minimum and maximum value of the tag that you want to display in a waveform.
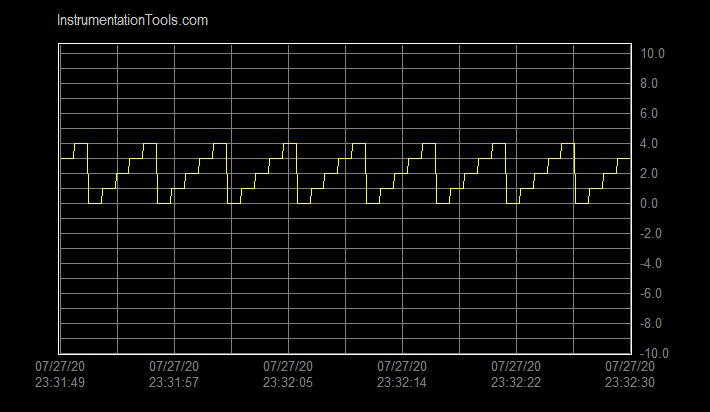
The maximum value of the tag that I am using is 5 and the minimum value is 0. I have given some extra range.
Now let’s go to run time and check whether the data is acquired.
Now you can see from the above image that the data is getting updated for the time you have mentioned in the update rate.
The graph will get updated left to right the old values will get disappeared and new ones will appear in the right.
Historical Trends
As the name indicates, historic trends are used to display the data in real-time at the same time the old data can be retrieved and viewed on the run time.
Whereas in the former it is not possible.
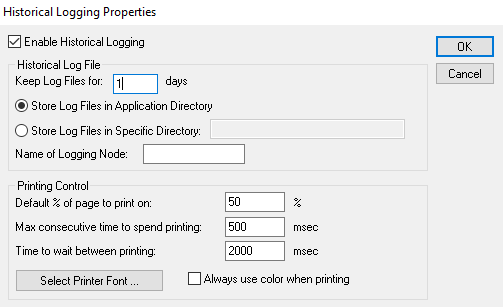
To enable Historical logging in Intouch SCADA go to, Special –> Configure –> Historical Logging.
The dialog box in the image appears now click enable Historic logging and mention the number of days the data has to log for.
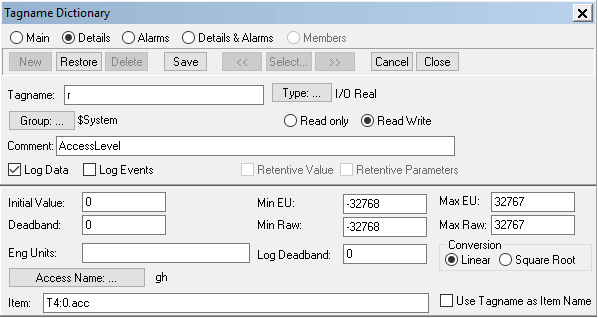
Click Ok and Now go to The tag dictionary and open the tag that we are acquiring data from.
Now enable log data in Checkbox. Click save and Ok.
Now let’s go to run time and see how to view the historical data,
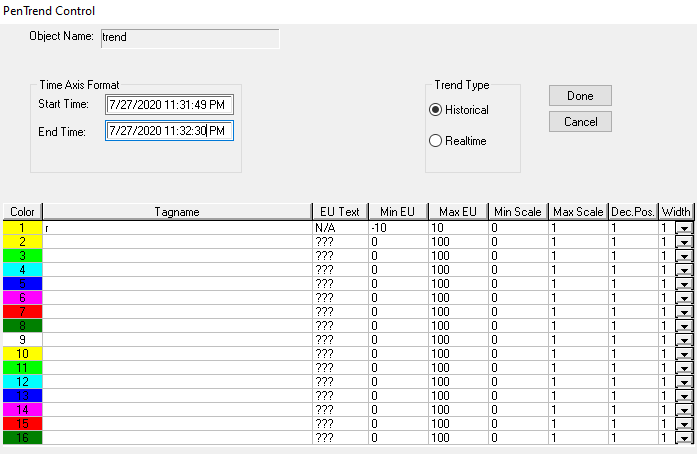
On the run time click on the trends a dialog box named trend control will appear.
Now click on Historical Trends, Mention the start time and the end time for which the data you need. Click Done.
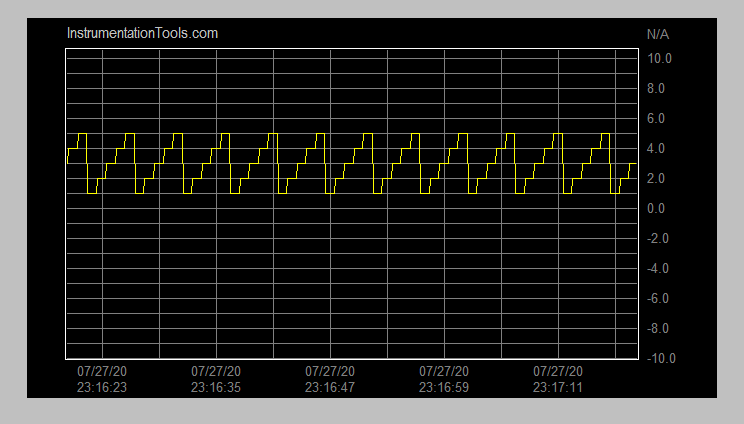
Now the historical for the mentioned time will be displayed on the run time as shown below.
Author: Abishek D
If you liked this article, then please subscribe to our YouTube Channel for PLC and SCADA video tutorials.
You can also follow us on Facebook and Twitter to receive daily updates.
Read Next:
- InTouch SCADA to Excel
- Coil Type Timers in PLC
- Advantages of RTO Timer
- Scaling for Analog Input
- Configuration of Alarms