Inst ToolsInst ToolsInst Tools
  • Courses
  • Automation
    • PLC
    • Control System
    • Safety System
    • Communication
    • Fire & Gas System
  • Instrumentation
    • Design
    • Pressure
    • Temperature
    • Flow
    • Level
    • Vibration
    • Analyzer
    • Control Valve
    • Switch
    • Calibration
    • Erection & Commissioning
  • Interview
    • Instrumentation
    • Electrical
    • Electronics
    • Practical
  • Q&A
    • Instrumentation
    • Control System
    • Electrical
    • Electronics
    • Analog Electronics
    • Digital Electronics
    • Power Electronics
    • Microprocessor
  • Request
Search
  • Books
  • Software
  • Projects
  • Process
  • Tools
  • Basics
  • Formula
  • Power Plant
  • Root Cause Analysis
  • Electrical Basics
  • Animation
  • Standards
  • 4-20 mA Course
  • Siemens PLC Course
Reading: Signal Strength of Guided-wave Radar Level Instrument
Share
Font ResizerAa
Inst ToolsInst Tools
Font ResizerAa
  • Courses
  • Design
  • PLC
  • Interview
  • Control System
Search
  • Courses
  • Automation
    • PLC
    • Control System
    • Safety System
    • Communication
    • Fire & Gas System
  • Instrumentation
    • Design
    • Pressure
    • Temperature
    • Flow
    • Level
    • Vibration
    • Analyzer
    • Control Valve
    • Switch
    • Calibration
    • Erection & Commissioning
  • Interview
    • Instrumentation
    • Electrical
    • Electronics
    • Practical
  • Q&A
    • Instrumentation
    • Control System
    • Electrical
    • Electronics
    • Analog Electronics
    • Digital Electronics
    • Power Electronics
    • Microprocessor
  • Request
Follow US
All rights reserved. Reproduction in whole or in part without written permission is prohibited.
Inst Tools > Blog > Practical Questions > Signal Strength of Guided-wave Radar Level Instrument

Signal Strength of Guided-wave Radar Level Instrument

The following graph shows the signal strength received by a guided-wave radar (GWR) level instrument over time.

Last updated: December 24, 2020 7:03 pm
Editorial Staff
Practical Questions
No Comments
Share
1 Min Read
SHARE

The following graph shows the signal strength received by a guided-wave radar (GWR) level instrument over time:

Guided-wave Radar

Signal Strength of Guided-wave Radar Level Instrument

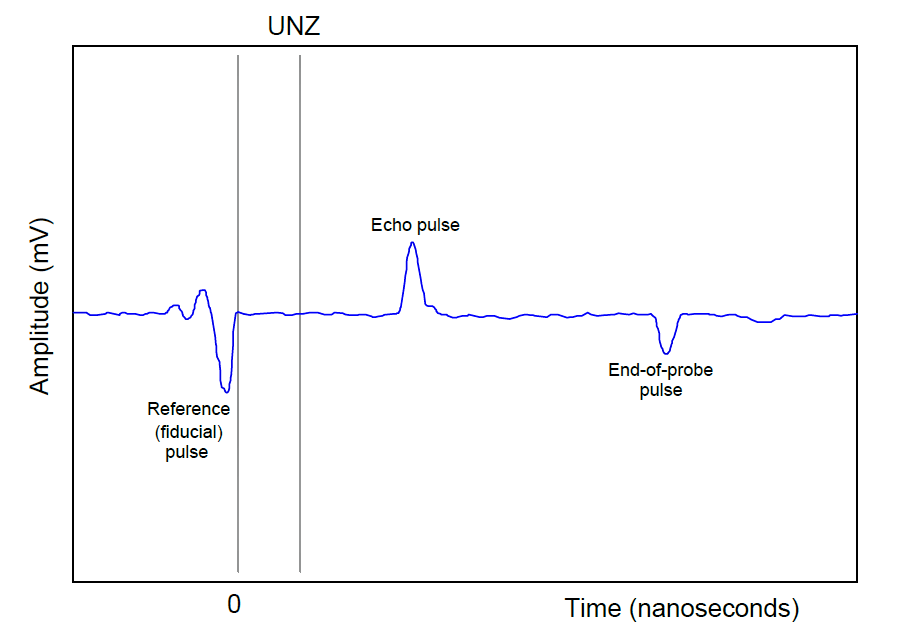
Explain how the graph will change if:

1. The liquid level increases

2. The dielectric constant (ε) of the liquid decreases

3. The density of the liquid decreases (assuming constant ε)

4. A liquid-liquid interface consisting of two liquids with different densities is introduced into the vessel

5. Also, explain what UNZ refers to (the Upper Null Zone).

6. Describe a practical reason for configuring a radar transmitter to have an upper null zone, and how this differs from a radar instrument’s transition zones.

7. Explain why the timing of both the echo pulse and the end-of-probe pulse will shift as liquid level changes in this system.

Share your answers and explanation with us through the below comments section.

Read Next:

  • Guided Wave Radar Questions
  • Ultrasonic Transmitter
  • Block and Bleed Valves
  • Stroke Checking Procedure
  • DP Transmitter Located

Credits: Tony R. Kuphaldt

Don't Miss Our Updates
Be the first to get exclusive content straight to your email.
We promise not to spam you. You can unsubscribe at any time.
Invalid email address
You've successfully subscribed !

Continue Reading

Thermocouple Measurement and Reference Junction Temperatures
PLC Program to Control a Water Pump
Practical Process Control System Questions & Answers – 2
Hydrostatic Level Measurement – Temperature related Density Change Effects
Resistance Temperature Detector (RTD) Questions – 1
Questions on Pneumatic Transmitter and Repeater
Share This Article
Facebook Whatsapp Whatsapp LinkedIn Copy Link
Share
Leave a Comment

Leave a Reply Cancel reply

Your email address will not be published. Required fields are marked *

Stay Connected

128.3kFollowersLike
69.1kFollowersFollow
210kSubscribersSubscribe
38kFollowersFollow

Categories

Explore More

Questions on Radar LT Loop Diagram
Current-to-Pressure Transducer Calibration Table
Calculation of Hydrostatic Pressure
Differential Pressure Transmitter with 5 Way Manifold Valve
Displacer Type Density Transmitter Question
Guided-wave Radar Asset Management Parameters
Displacer Level Transmitter Question & Answer
Practical Process Control System Questions & Answers – 9

Keep Learning

Accuracy of a Manometer

What Affect the Pressure Measurement Accuracy of a Manometer?

float-type level switch control a pump

Float-type Level Switch to Control a pump

Identify which lamp in the following ladder-logic diagram

Identify High Flow Alarm and Low Flow Alarm?

Level Transmitter trend

Identify Level Control Loop Tuning Problems

Tank uses 3 Pressure Transmitters to Measure Level & Density

Tank uses 3 Pressure Transmitters to Measure Level & Density

Level Loop Troubleshooting

Identify Faults in PID Control Loop

burner management system P&ID

Solenoid Valves Questions & Answers – 1

Alternative Vessel Level Indication

What is the Simple Alternative Vessel Level Indication?

Learn More

level gauge

Basics of Sight Glass Level Gauge

Control Systems Questions & Answers

Control Systems Objective Questions & Answers – Set 1

control of pneumatic systems

Control of Pneumatic Cylinder and Motor

HART Communication Interview Questions

HART Communication Interview Questions and Answers

A Typical Sequential Function Chart

What is Sequential Function Chart (SFC?)

PLC program for Latching and unlatched circuit

PLC Program for Latching and unlatching Circuit

high-accuracy voltmeter

Electrical Standards

Problem on Tachogenerator

Problem on Tachogenerator

Menu

  • About
  • Privacy Policy
  • Copyright

Quick Links

  • Learn PLC
  • Helping Hand
  • Part Time Job

YouTube Subscribe

Follow US
All rights reserved. Reproduction in whole or in part without written permission is prohibited.
Welcome Back!

Sign in to your account

Username or Email Address
Password

Lost your password?