Piping and Instrumentation Diagram (P&ID) is a drawing elaborating the details of piping and instrumentation of a processing plant, developed at the design stage. P&ID is later used for assistance for construction of the corresponding plant and for operating that plant. P&IDs of a plant are developed by process design engineers and are followed by instrumentation and piping engineers. A P&ID is normally developed from a Process Flow Diagram (PFD) which captures the basic process flow, at the design stage of a plant
A P&ID should provide following data to piping and instrument engineers, to construction teams and to the operators:
- Equipments – tanks, vessels, heat exchangers, pumps, compressors, columns etc. have to be indicated with type, reference tag numbers, basic design data, spares etc.
- Lines – reference tag numbers, piping material class, line size, fluid service, insulation type and thickness etc. Sometimes process data such as line operating pressure, temperature and flowrates is also represented on the P&ID lines.
- Some other piping requirements – such as slope, special insulation such as heat tracing, minimum / maximum piping distance requirements along with their values are also shown on P&IDs.
- Manually operated piping valves – valve type (ball valve, gate valve, check valve etc.), valve size, Locked closed/open, sealed closed/open, normally closed/open etc.
- Piping fittings – Flanges, reducers/expanders, spectacle blinds, spacers, strainers etc. along with their size wherever necessary.
- Drains and Vents – are usually indicated using typical symbols along with their size and type (single valve, double valve etc.).
- Automated valves – Shutdown valves (SDV), control valves, blowdown valves (BDV) are indicated with size if it is known. Also fail position (fail open/fail close/fail in position) is indicated for each of these valves.Actuator connection and type is indicated. Reference instrument tag numbers are attached to every automatic valves.
- Safety Valves – Pressure relief valve (PRV) or Temperature relief valve (TRV) are indicated with their instrument tag numbers, setpoints, types are indicated by different symbols.
- Instruments – Gauges, transmitters, local indicators, DCS indicators, interlocks and other functions have to be shown in detail on the P&ID. Interconnection between these elements has to be indicated by different types of instrument signals (hardwired signal, soft signal, pneumatic or hydraulic signal etc.). The location of the instrument elements (field mounted or DCS) is indicated by difference between symbols.
- Notes – are written wherever required to improve clarity for anyone referring to the P&ID. Sometime ‘Hold’ is used to indicate uncertainty about relevant data.
- Interconnections (OPC) – are shown between lines (piping OPC) and instrument signals (Instrument OPC) present on two different P&ID sheets. Sometime these interconnectors are also assigned with a unique tag number. For easy identification of the connections between two P&IDs. A connector present on two different drawing connection a line or a signal carries the same tag number.
Because of the numerous details involved in P&IDs for each equipment, usually only one main equipment is shown on one P&ID sheet with related instruments and piping.
Contents and function
A piping and instrumentation diagram/drawing (P&ID) is defined by the Institute of Instrumentation and Control as follows:
- A diagram which shows the interconnection of process equipment and the instrumentation used to control the process. In the process industry, a standard set of symbols is used to prepare drawings of processes. The instrument symbols used in these drawings are generally based on International Society of Automation (ISA) Standard S5. 1.
- The primary schematic drawing used for laying out a process control installation.
P&IDs play a significant role in the maintenance and modification of the process that it describes. It is critical to demonstrate the physical sequence of equipment and systems, as well as how these systems connect. During the design stage, the diagram also provides the basis for the development of system control schemes, allowing for further safety and operational investigations, such as a Hazard and operability study commonly pronounced as HAZOP.
For processing facilities, it is a pictorial representation of
- Key piping and instrument details
- Control and shutdown schemes
- Safety and regulatory requirements
- Basic start up and operational information
List of P&ID items
- Instrumentation and designations
- Mechanical equipment with names and numbers
- All valves and their identifications
- Process piping, sizes and identification
- Miscellanea – vents, drains, special fittings, sampling lines, reducers, increasers and swaggers
- Permanent start-up and flush lines
- Flow directions
- Interconnections references
- Control inputs and outputs, interlocks
- Interfaces for class changes
- Computer control system
- Identification of components and subsystems
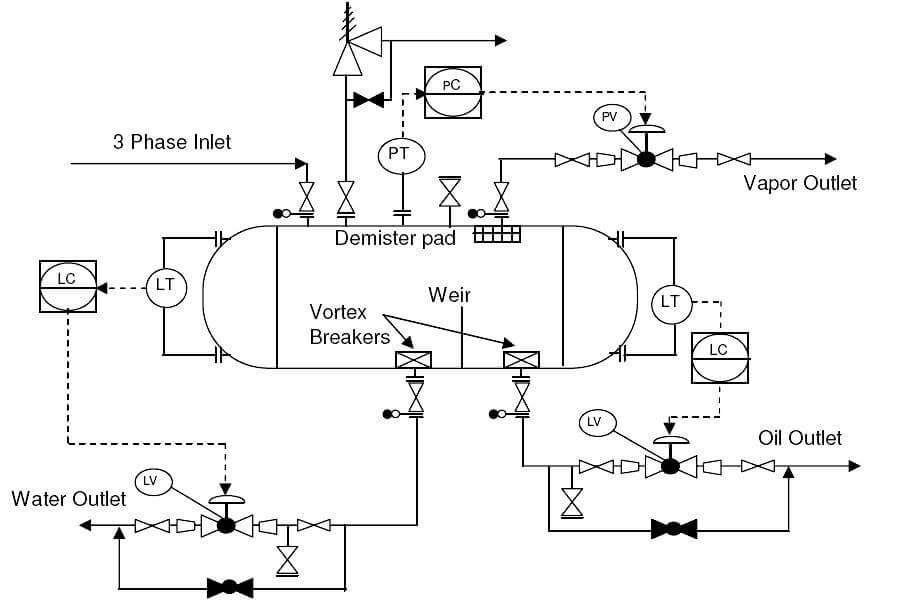
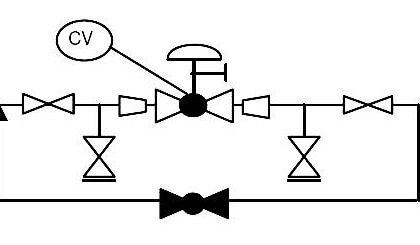
Piping and Instrumentation Diagram Example :


Dear Sir,
Thanks for such a good articles.
Could you pls. suggest how to download the subject article for studying purpose.
Thanks,
Sir Hindi me Aap banaye plz sir
Aap hindi language bhi select kar sakate hai.Jisase sabhi lekho ka anuwaad hindi me ho jaayega.
Thanks.
Really useful information. Looking forward to latest developments in Instrumentation.
Very interested and useful Website for Instrumentation Engineers and Technician.
i get great understanding on your post thank you