To read a drawing correctly, the user must have a basic understanding of the various categories of drawings and the views and perspectives in which each drawing can be presented.
Categories of Drawings
The previous chapter reviewed the non-drawing portions of a print. This chapter will introduce the five common categories of drawings.
They are :
- Piping and instrument drawings (P&IDs),
- Electrical single lines and schematics,
- Electronic diagrams and schematics,
- Logic diagrams and prints, and
- Fabrication, construction, and architectural drawings.
Piping and Instrument Drawings (P&IDs)
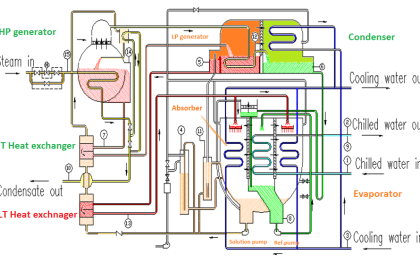
P&IDs are usually designed to present functional information about a system or component.
Examples are piping layout, flowpaths, pumps, valves, instruments, signal modifiers, and controllers, as illustrated in Figure 6.
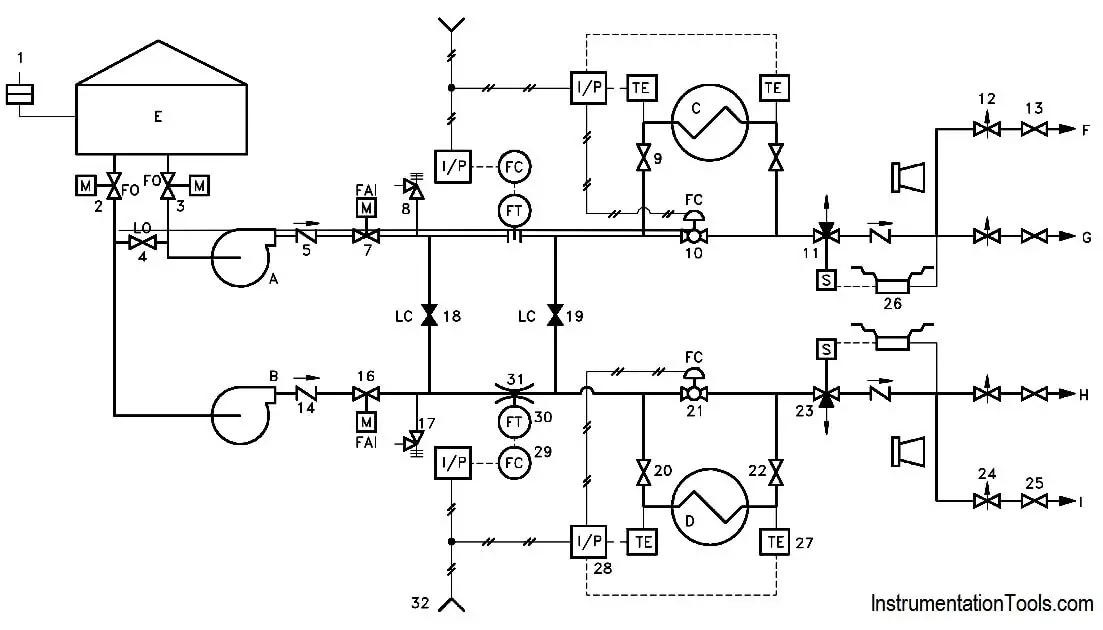
Figure 6 : Example P&ID
As a rule P&IDs do not have a drawing scale and present only the relationship or sequence between components. Just because two pieces of equipment are drawn next to each other does not indicate that in the plant the equipment is even in the same building; it is just the next part or piece of the system.
These drawings only present information on how a system functions, not the actual physical relationships. Because P&IDs provide the most concise format for how a system should function, they are used extensively in the operation, repair, and modification of the plant.
Electrical Single Lines and Schematics
Electrical single lines and schematics are designed to present functional information about the electrical design of a system or component. They provide the same types of information about electrical systems that P&IDs provide for piping and instrument systems. Like P&IDs, electrical prints are not usually drawn to scale.
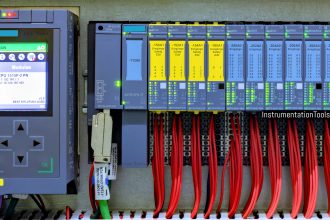
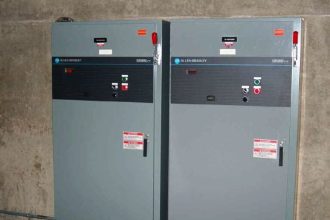
Examples of typical single lines are site or building power distribution, system power distribution, and motor control centers. Figure 7 is an example of an electrical single line.
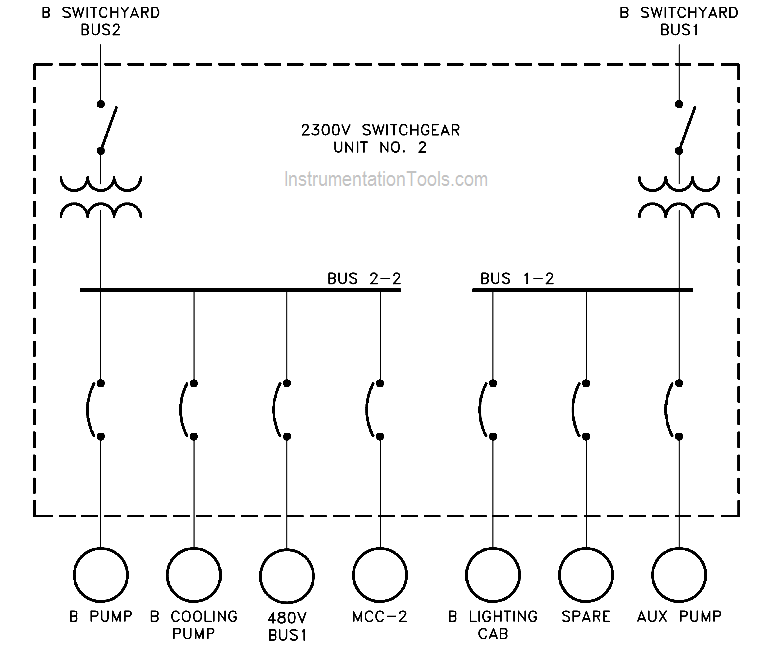
Figure 7 : Example of a Single Line
Electrical schematics provide a more detailed level of information about an electrical system or component than the single lines. Electrical schematic drawings present information such as the individual relays, relay contacts, fuses, motors, lights, and instrument sensors. Examples of typical schematics are valve actuating circuits, motor start circuits, and breaker circuits.
Figure 8 is an example of a motor start circuit schematic. Electrical single lines and schematics provide the most concise format for depicting how electrical systems should function, and are used extensively in the operation, repair, and modification of the plant.
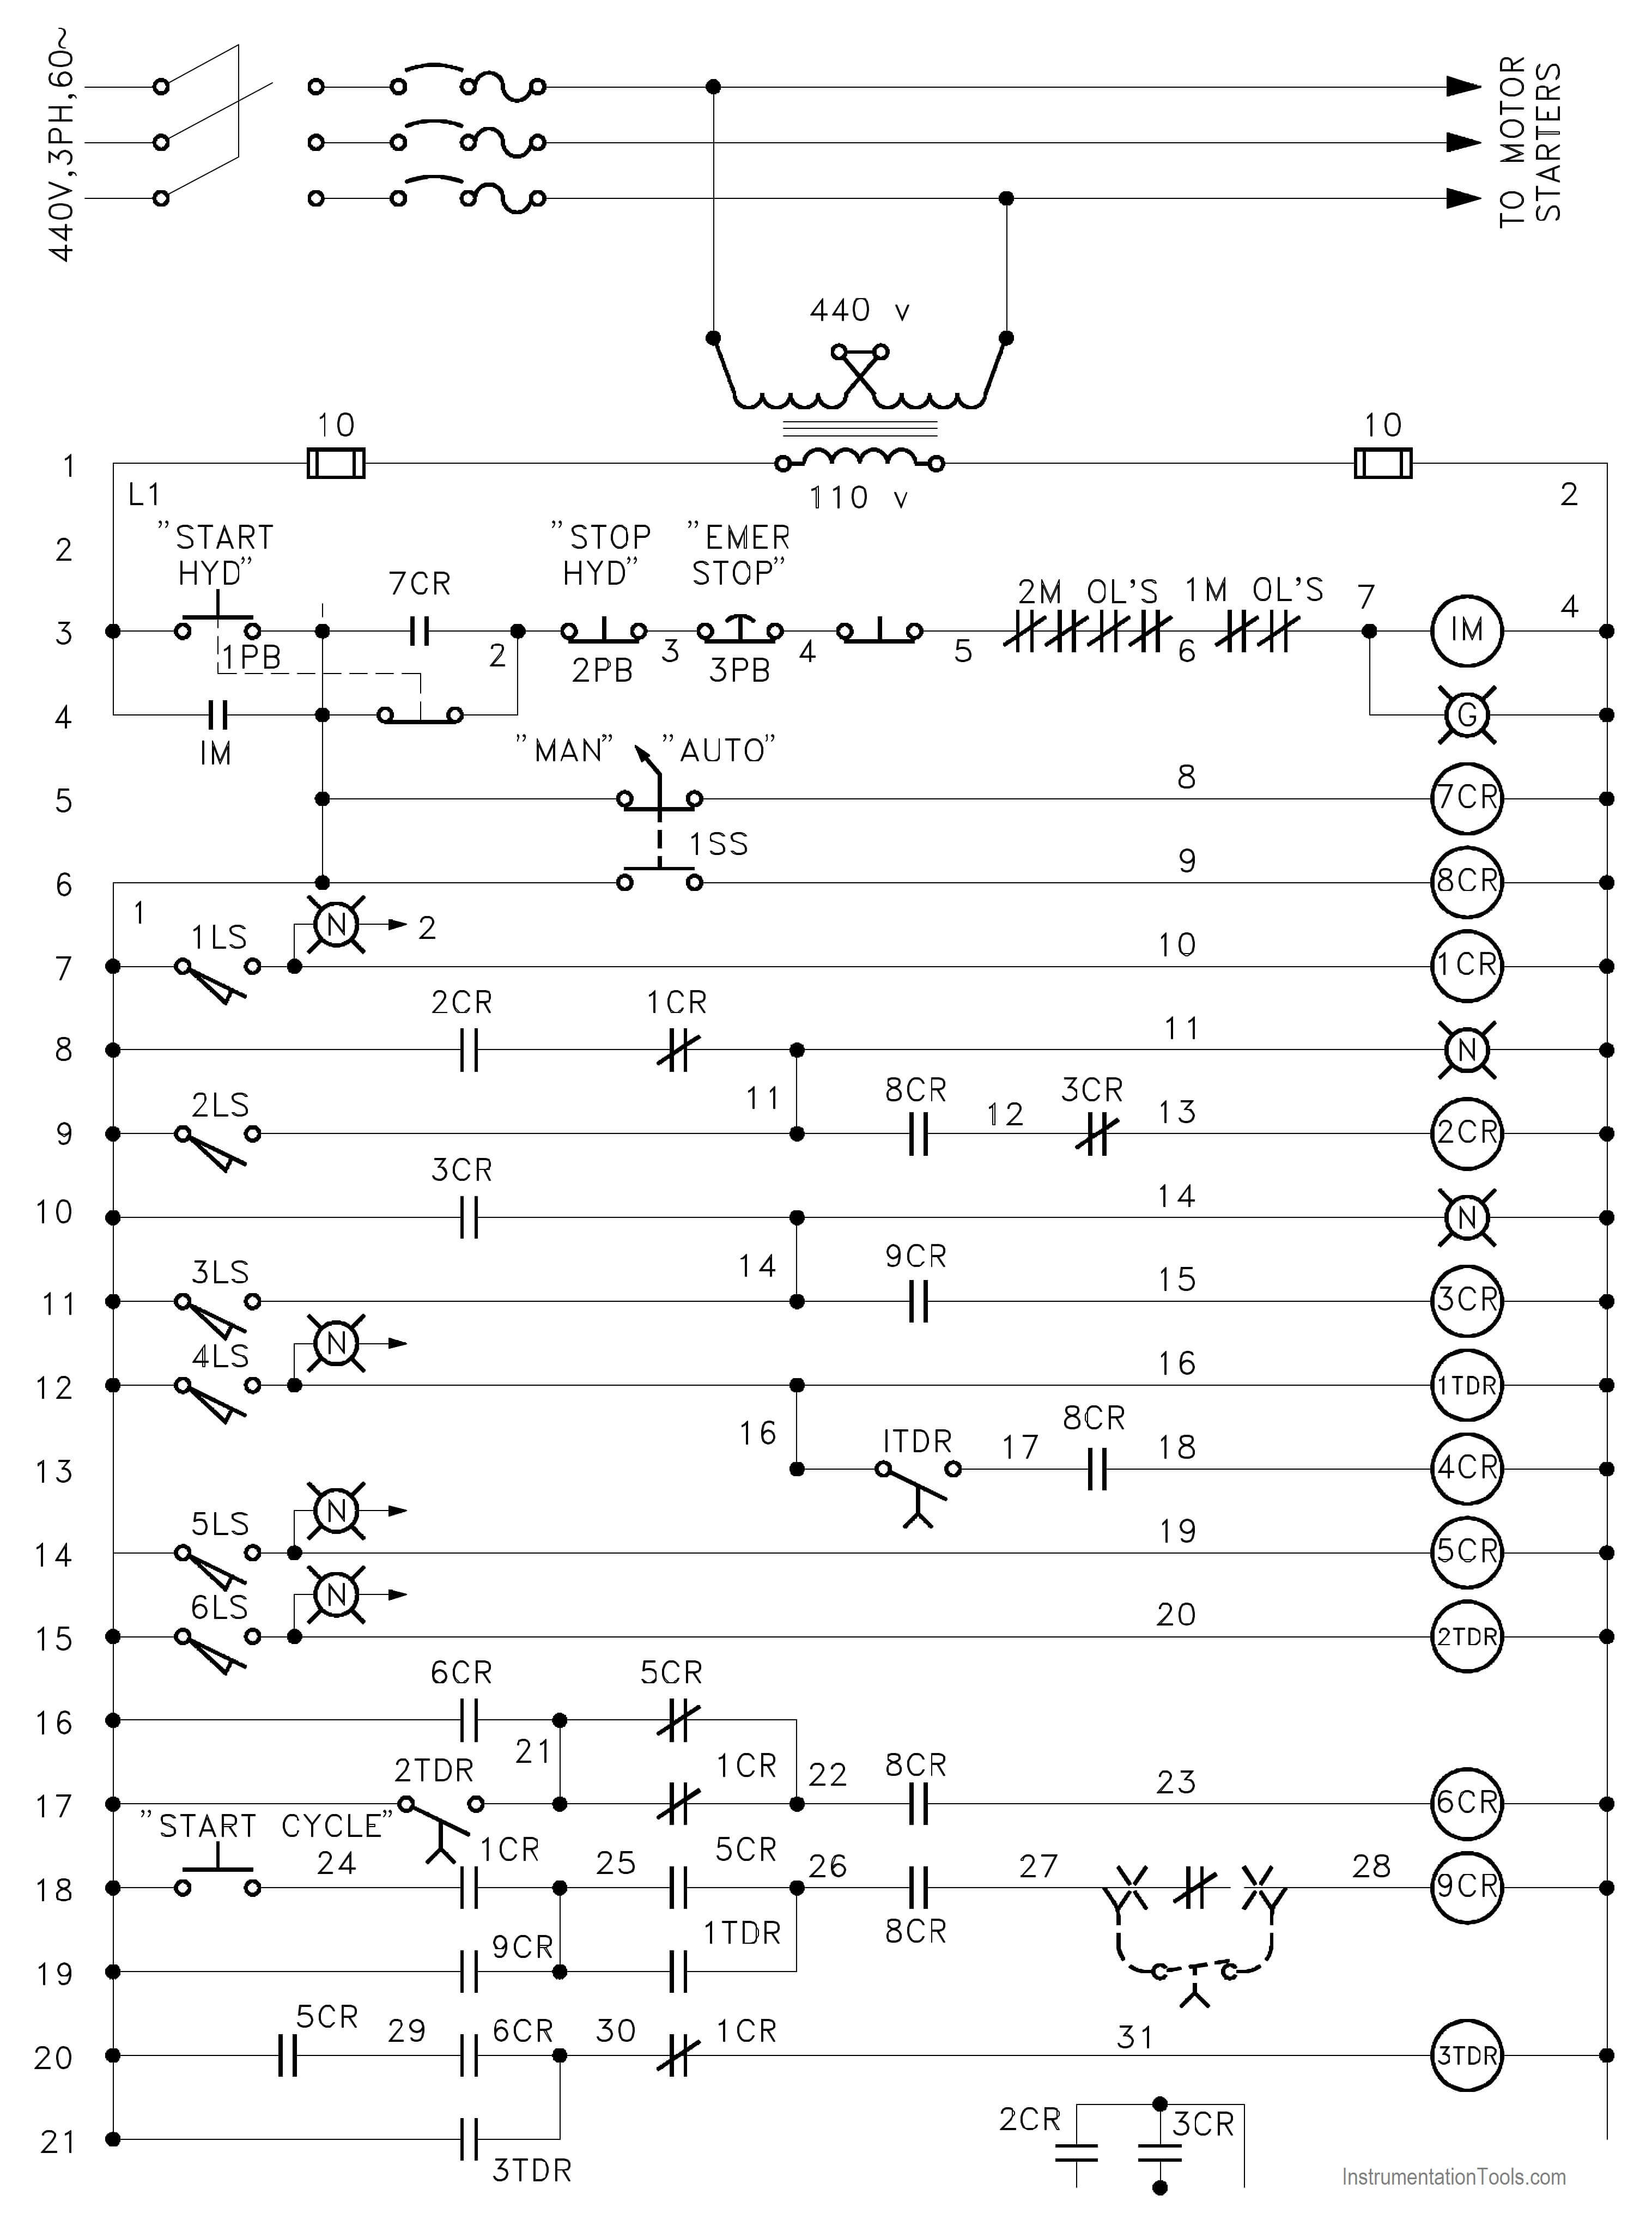
Figure 8 : Example of a Schematic
Electronic Diagrams and Schematics
Electronic diagrams and schematics are designed to present information about the individual components (resistors, transistors, and capacitors) used in a circuit, as illustrated in Figure 9. These drawings are usually used by circuit designers and electronics repair personnel.
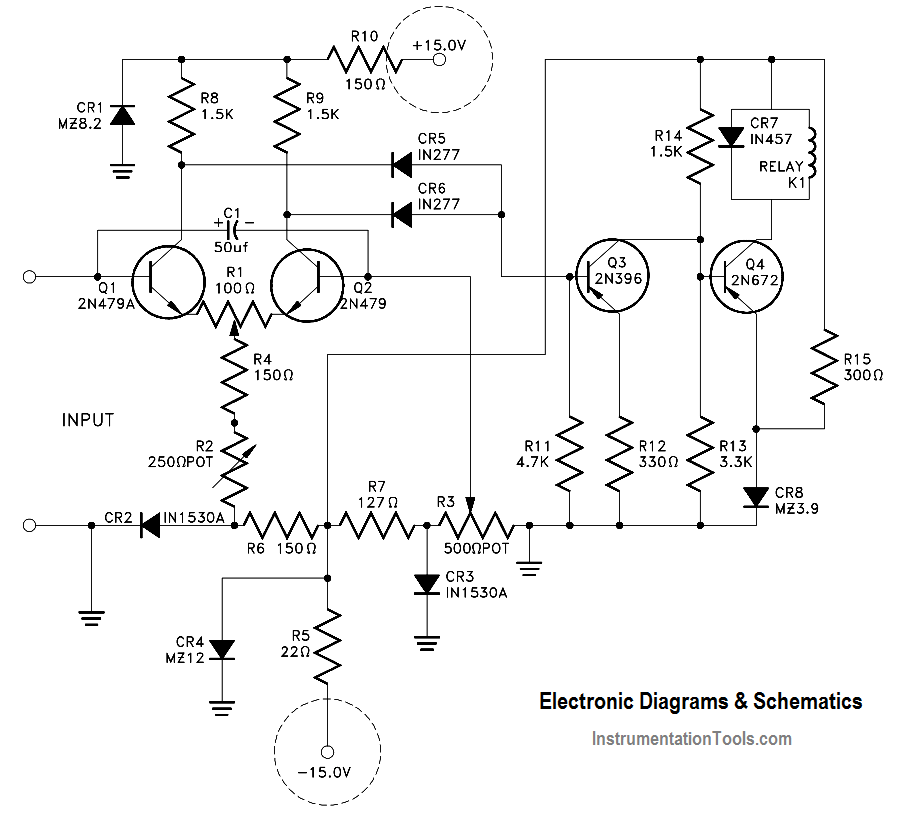
Figure 9 : Example of an Electronic Diagram
Logic Diagrams and Prints
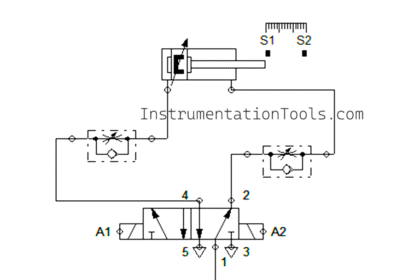
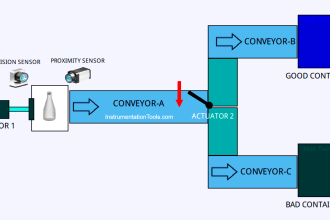
Logic diagrams and prints can be used to depict several types of information. The most common use is to provide a simplified functional representation of an electrical circuit, as illustrated in Figure 10.
For example, it is easier and faster to figure out how a valve functions and responds to various inputs signals by representing a valve circuit using logic symbols, than by using the electrical schematic with its complex relays and contacts. These drawings do not replace schematics, but they are easier to use for certain applications.
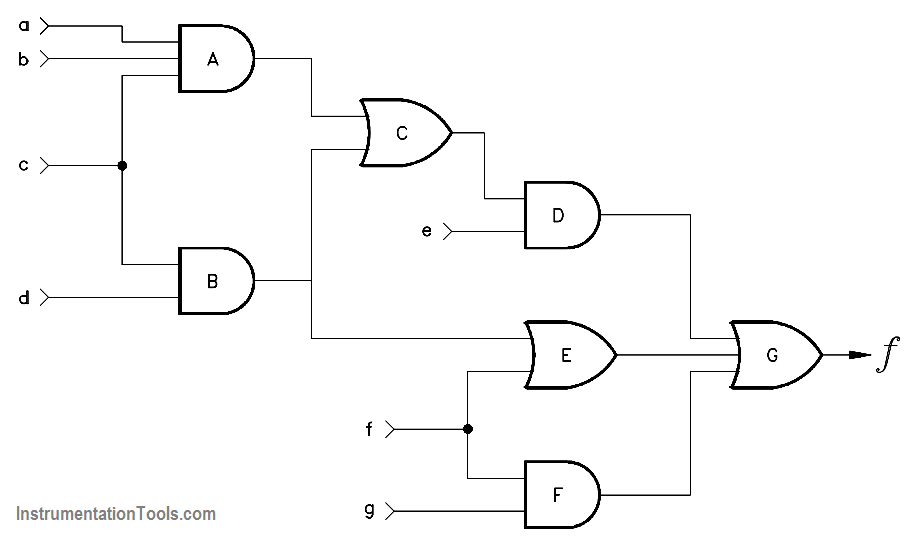
Figure 10 : Example of a Logic Print
Fabrication, Construction, and Architectural Drawings
Fabrication, construction, and architectural drawings are designed to present the detailed information required to construct or fabricate a part, system, or structure. These three types of drawings differ only in their application as opposed to any real differences in the drawings themselves.
Construction drawings, commonly referred to as “blueprint” drawings, present the detailed information required to assemble a structure on site. Architectural drawings present information about the conceptual design of the building or structure. Examples are house plans, building elevations (outside view of each side of a structure), equipment installation drawings, foundation drawings, and equipment assembly drawings.
Fabrication drawings, as shown in Figure 11, are similar to construction and architectural drawing but are usually found in machine shops and provide the necessary detailed information for a craftsman to fabricate a part. All three types of drawings, fabrication, construction, and architectural, are usually drawn to scale.
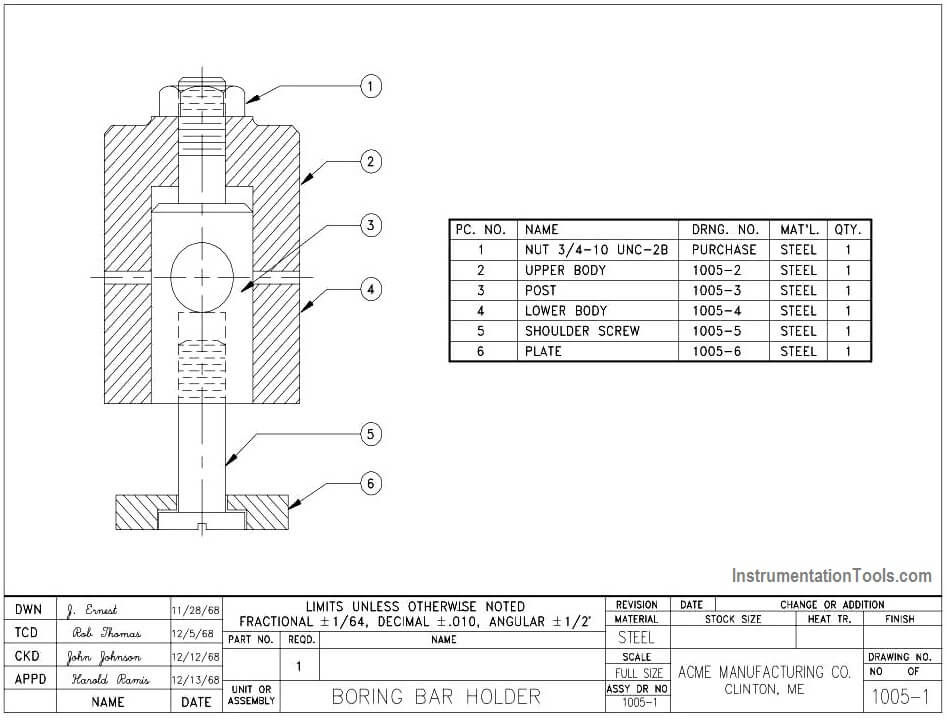
Figure 11 : Example of a Fabrication Drawing
Drawing Format
P&IDs, fabrication, construction, and architectural drawings can be presented using one of several different formats. The standard formats are single line, pictorial or double line, and cutaway. Each format provides specific information about a component or system.
Single Line P&ID Drawings
The single line format is most commonly used in P&IDs. Figure 12 is an example of a single line P&ID. The single line format represents all piping, regardless of size, as single line. All system equipment is represented by simple standard symbols (covered in later modules).
By simplifying piping and equipment, single lines allow the system’s equipment and instrumentation relationships to be clearly understood by the reader.
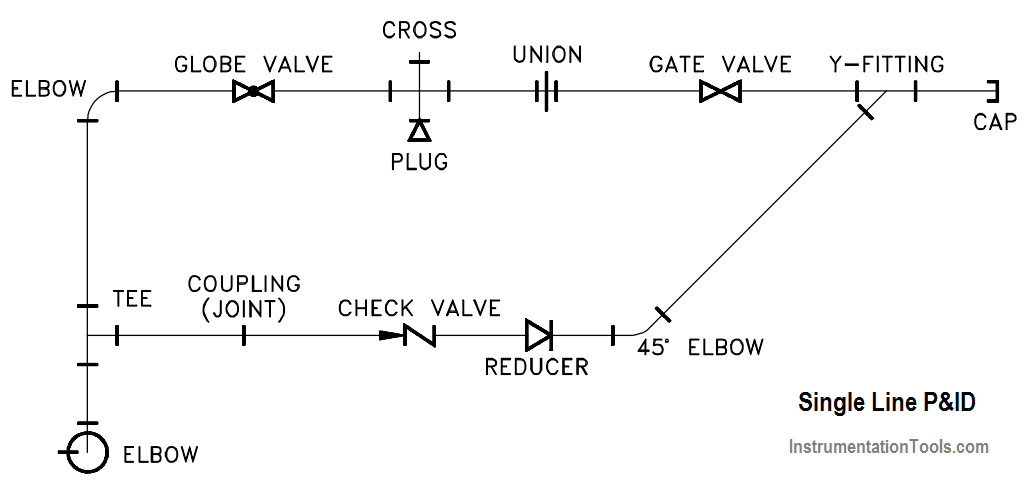
Figure 12 : Example of a Single Line P&ID
Pictorial or Double Line Drawings
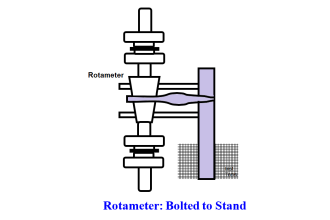
Pictorial or double line drawings present the same type information as a single line, but the equipment is represented as if it had been photographed. Figure 13 provides an example illustration of a pictorial drawing. This format is rarely used since it requires much more effort to produce than a single line drawing and does not present any more information as to how the system functions.
Compare the pictorial illustration, Figure 13, to the single line of the same system shown in Figure 12. Pictorial or double line drawings are often used in advertising and training material.

Figure 13 : Example Pictorial
Assembly Drawings
Assembly drawing are a special application of pictorial drawings that are common in the engineering field. As seen in Figure 14, an assembly drawing is a pictorial view of the object with all the components shown as they go together.
This type pictorial is usually found in vendor manuals and is used for parts identification and general information relative to the assembly of the component.

Figure 14 : Example of an Assembly Drawing
Cutaway Drawings
A cutaway drawing is another special type of pictorial drawing. In a cutaway, as the name implies, the component or system has a portion cut away to reveal the internal parts of the component or system.
Figure 15 is an illustration of a cutaway. This type of drawing is extremely helpful in the maintenance and training areas where the way internal parts are assembled is important.
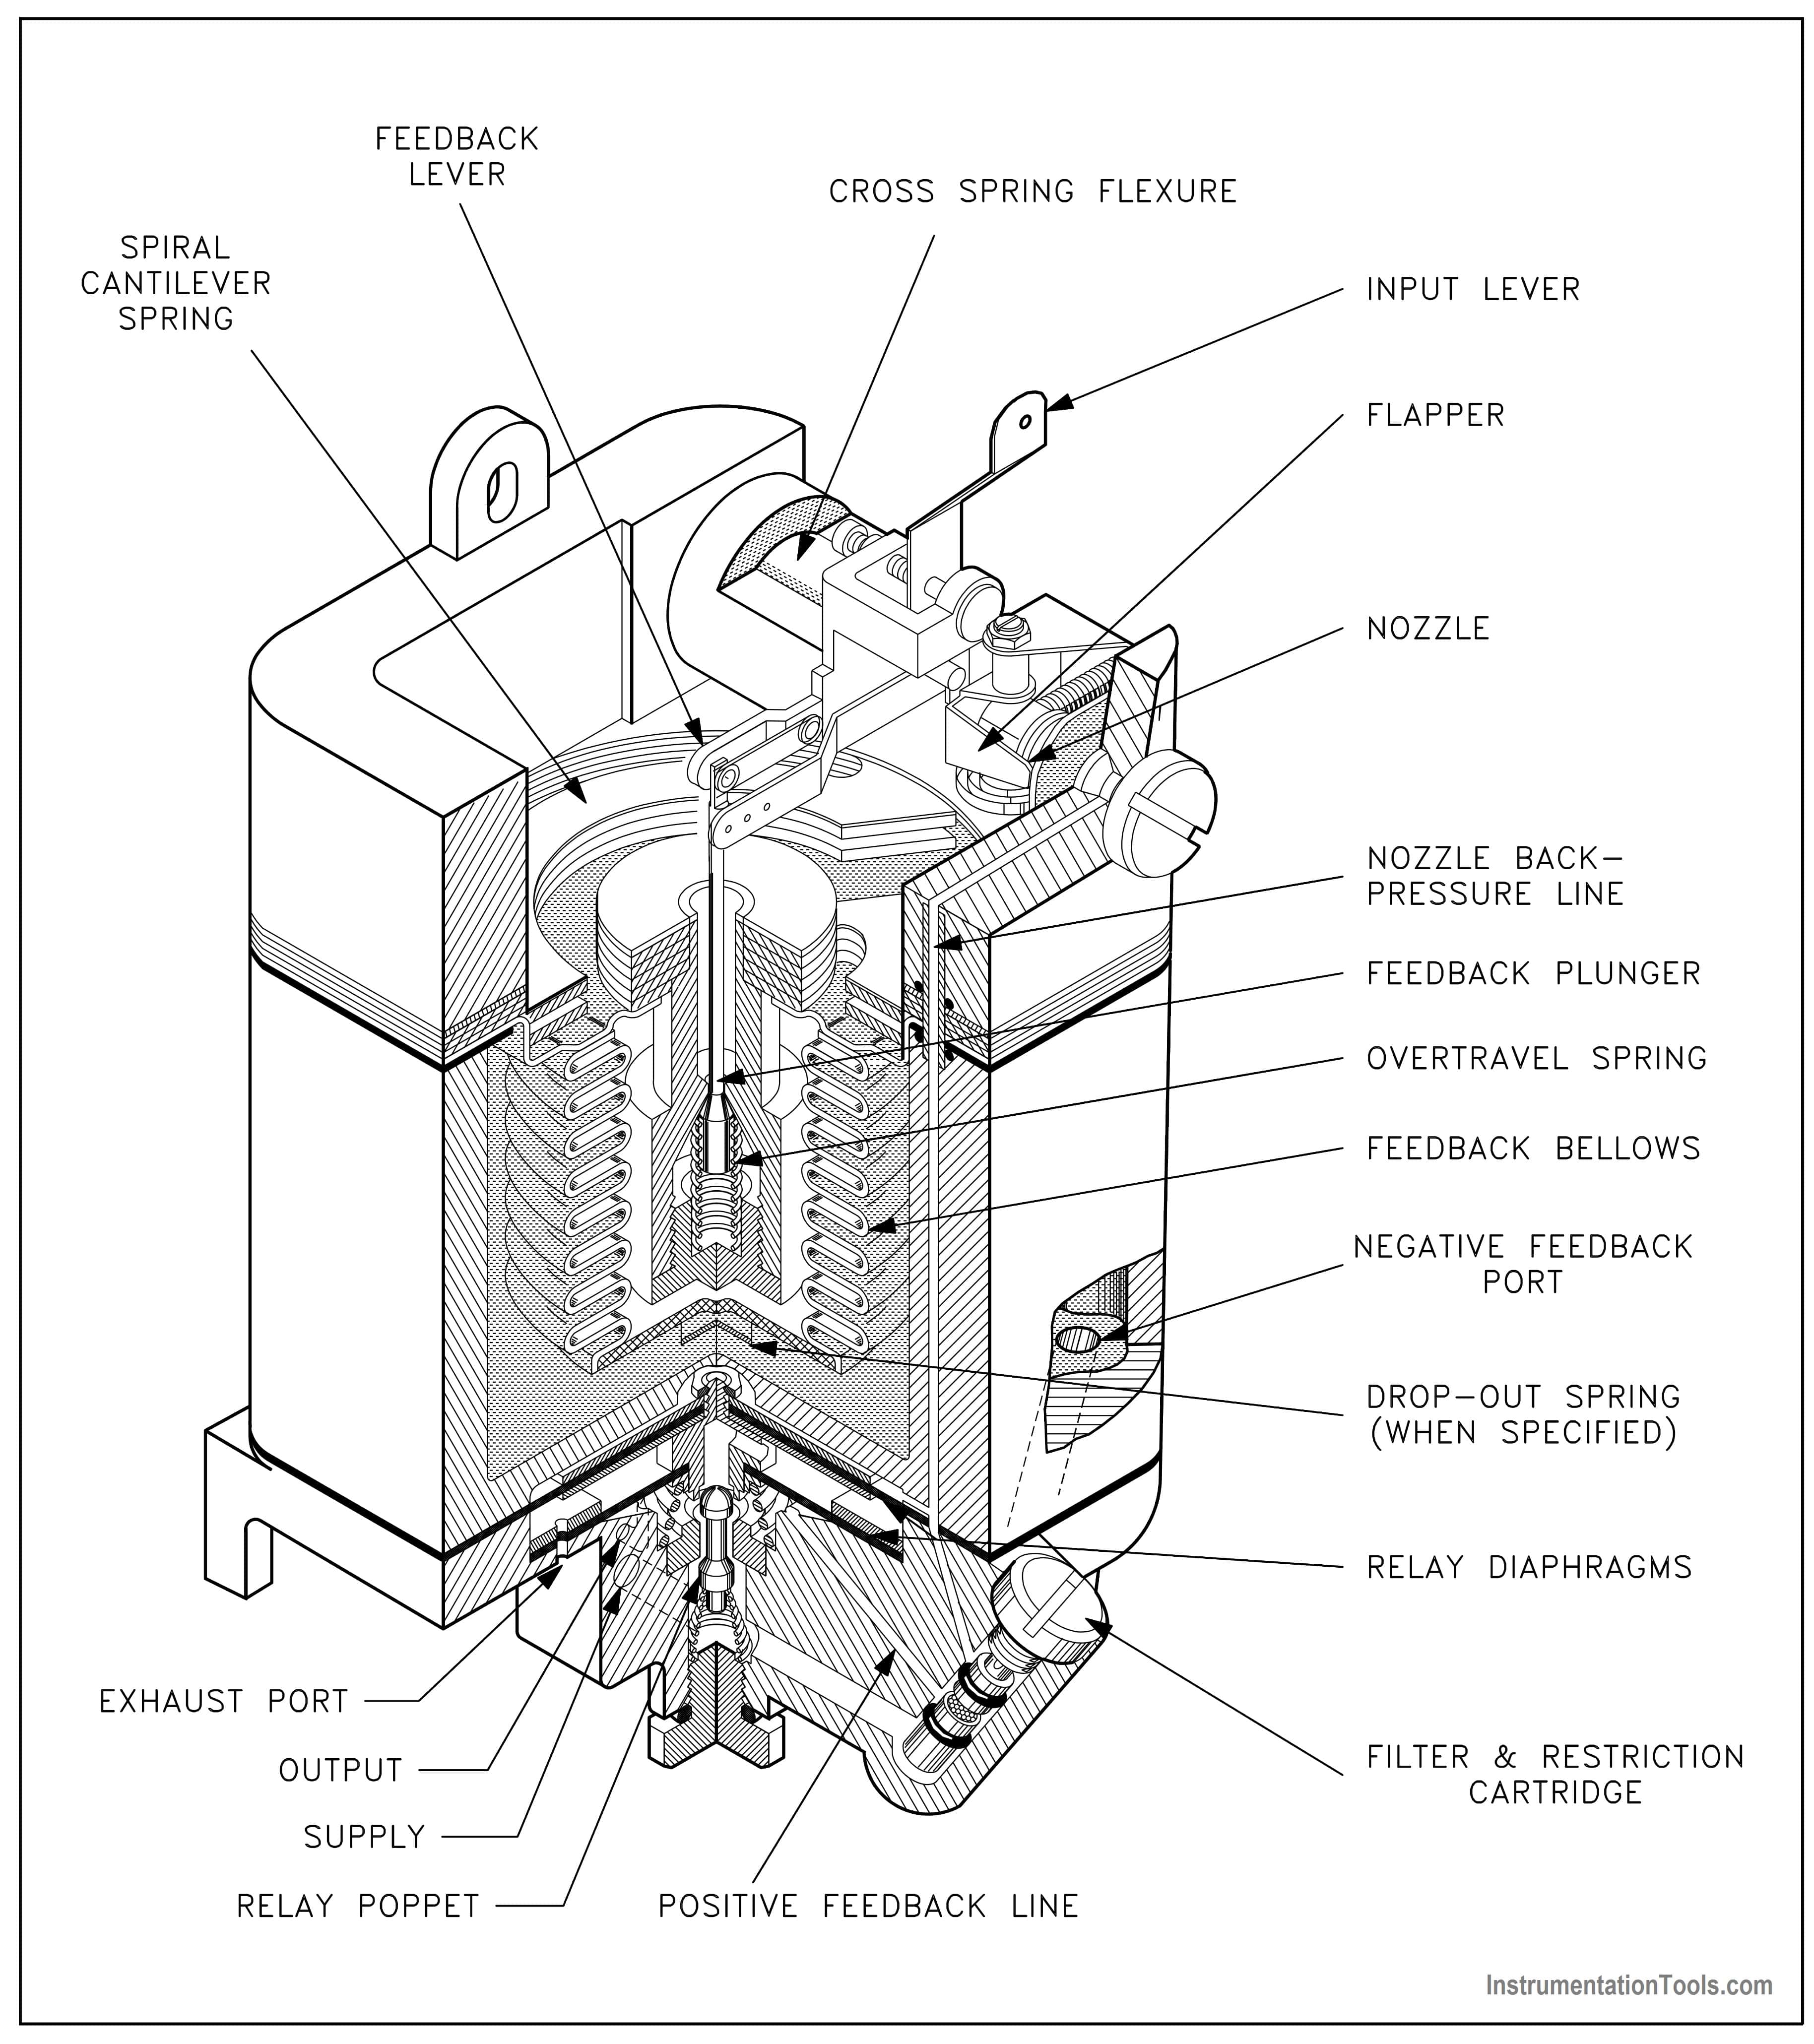
Figure 15 : Example of a Cutaway
Views and Perspectives
In addition to the different drawing formats, there are different views or perspectives in which the formats can be drawn. The most commonly used are the orthographic projection and the isometric projection.
Orthographic Projections
Orthographic projection is widely used for fabrication and construction type drawings, as shown in Figure 16. Orthographic projections present the component or system through the use of three views, These are a top view, a side view, and a front view. Other views, such as a bottom view, are used to more fully depict the component or system when necessary.
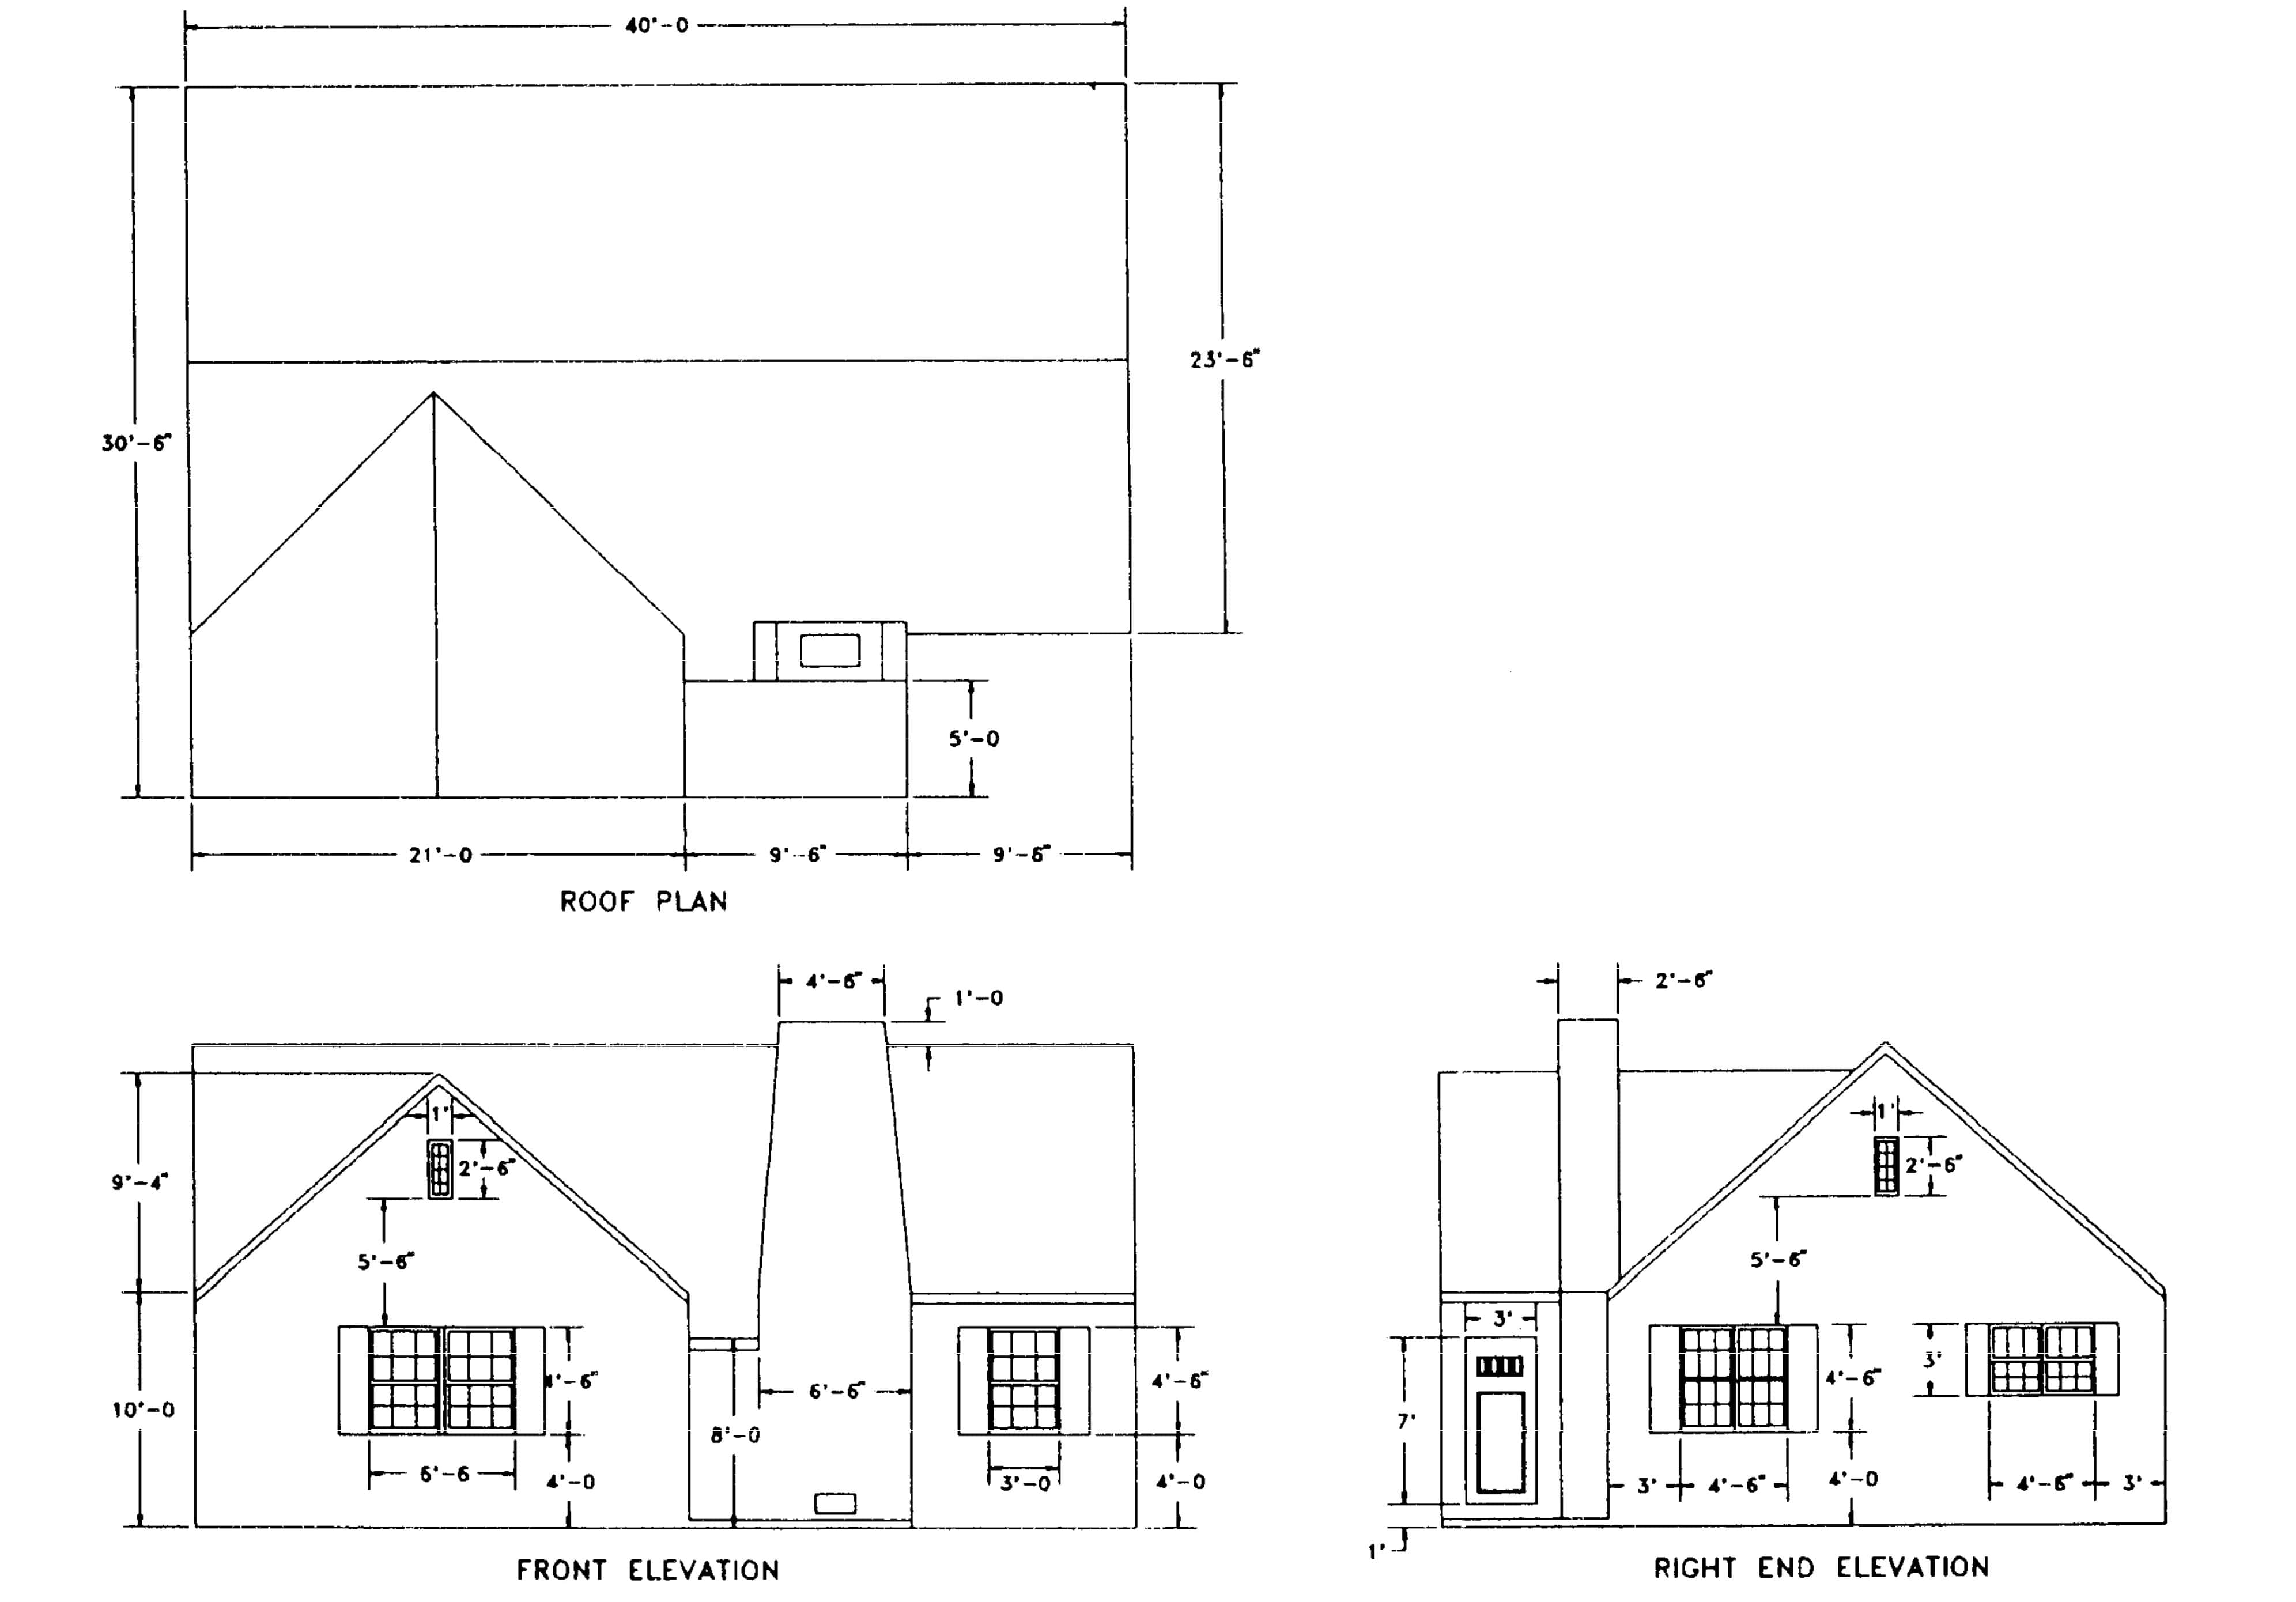
Figure 16 : Example Orthographic Projection
Figure 17 shows how each of the three views is obtained. The orthographic projection is typically drawn to scale and shows all components in their proper relationships to each other.
The three views, when provided with dimensions and a drawing scale, contain information that is necessary to fabricate or construct the component or system.
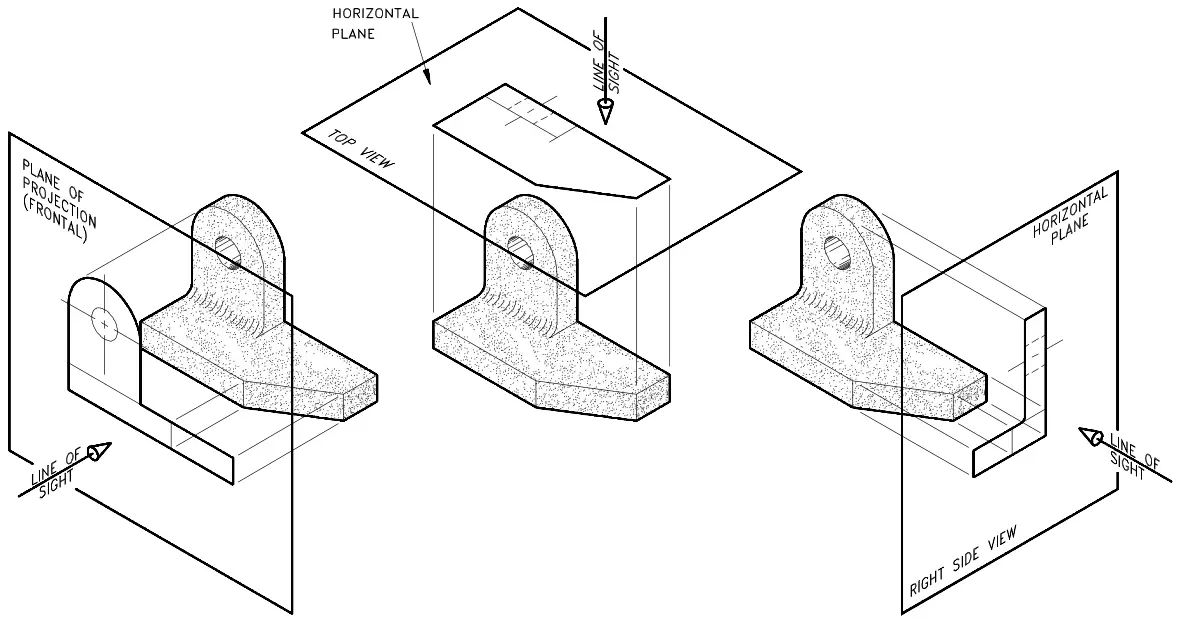
Figure 17 : Orthographic Projections
Isometric Projection
The isometric projection presents a single view of the component or system. The view is commonly from above and at an angle of 30°. This provides a more realistic three dimensional view.
As shown on Figure 18, this view makes it easier to see how the system looks and how its various portions or parts are related to one another. Isometric projections may or may not be drawn to a scale.
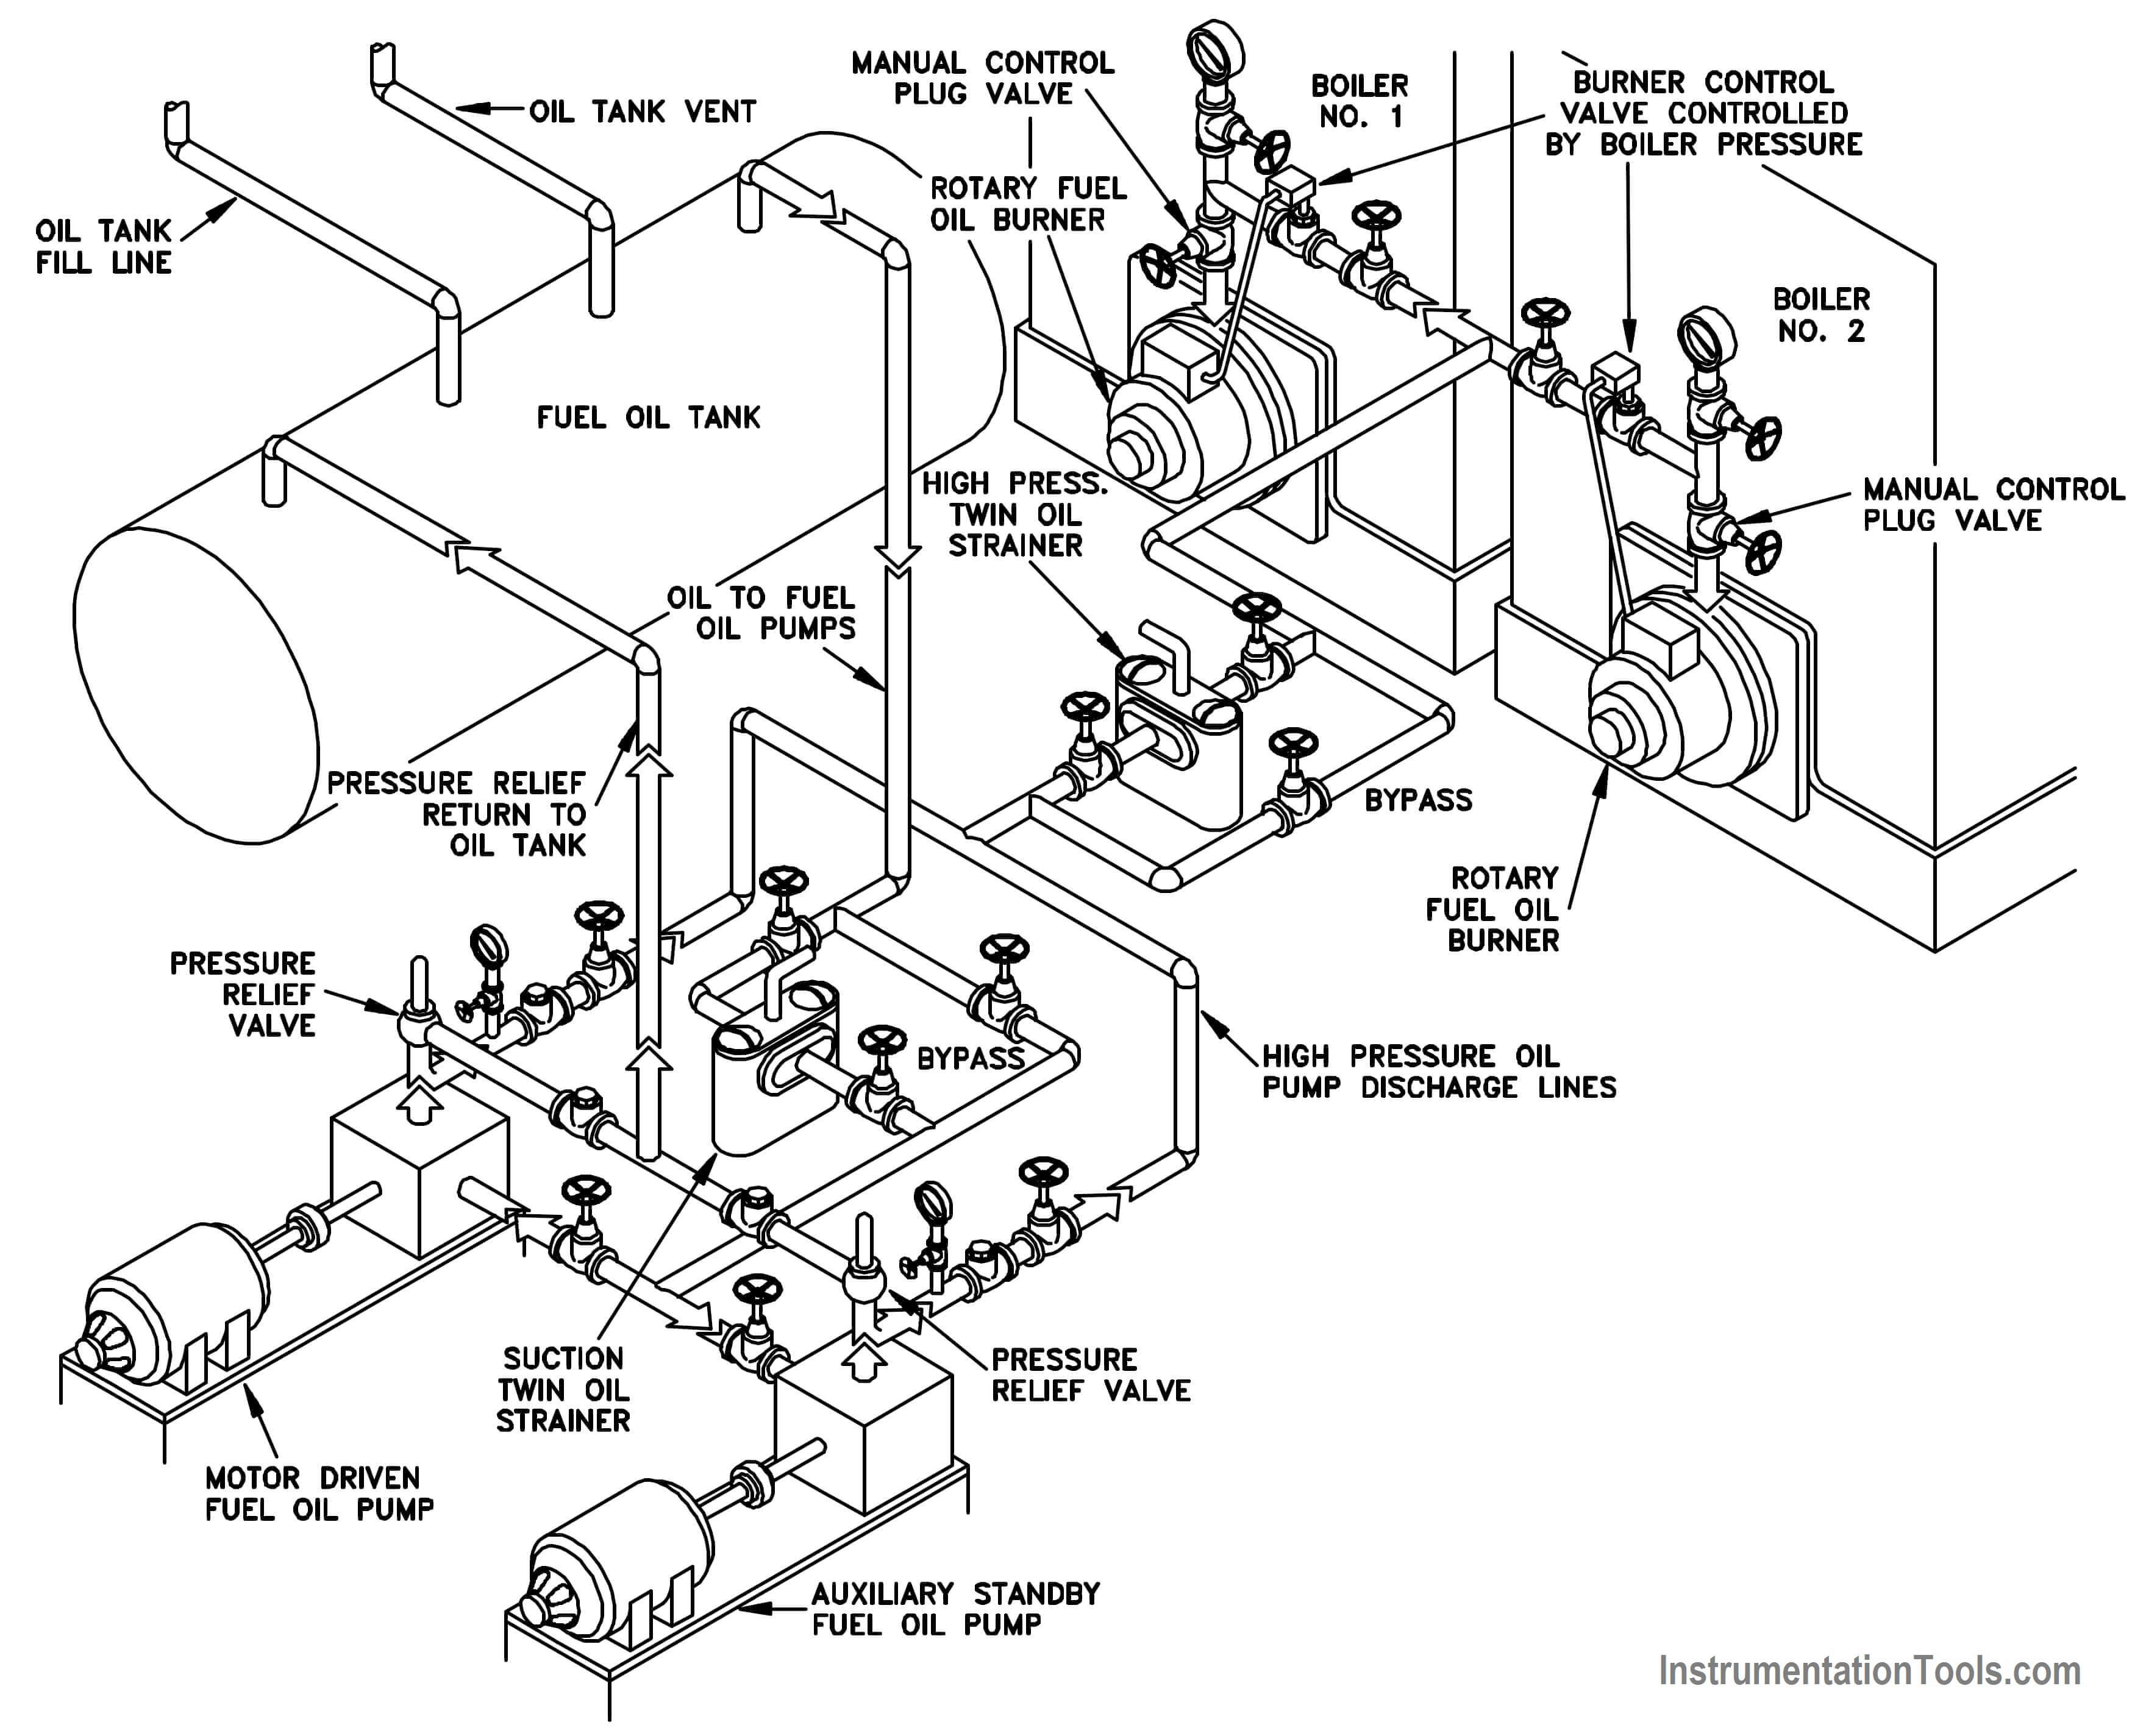
Figure 18 : Example of an Isometric