In this article, we will study the Static and Dynamic Characteristics of an Instrument.
Several factors affect the performance of measuring instruments.
Static Characteristics and Dynamic Characteristics are two basic performance characteristics of measuring instruments.
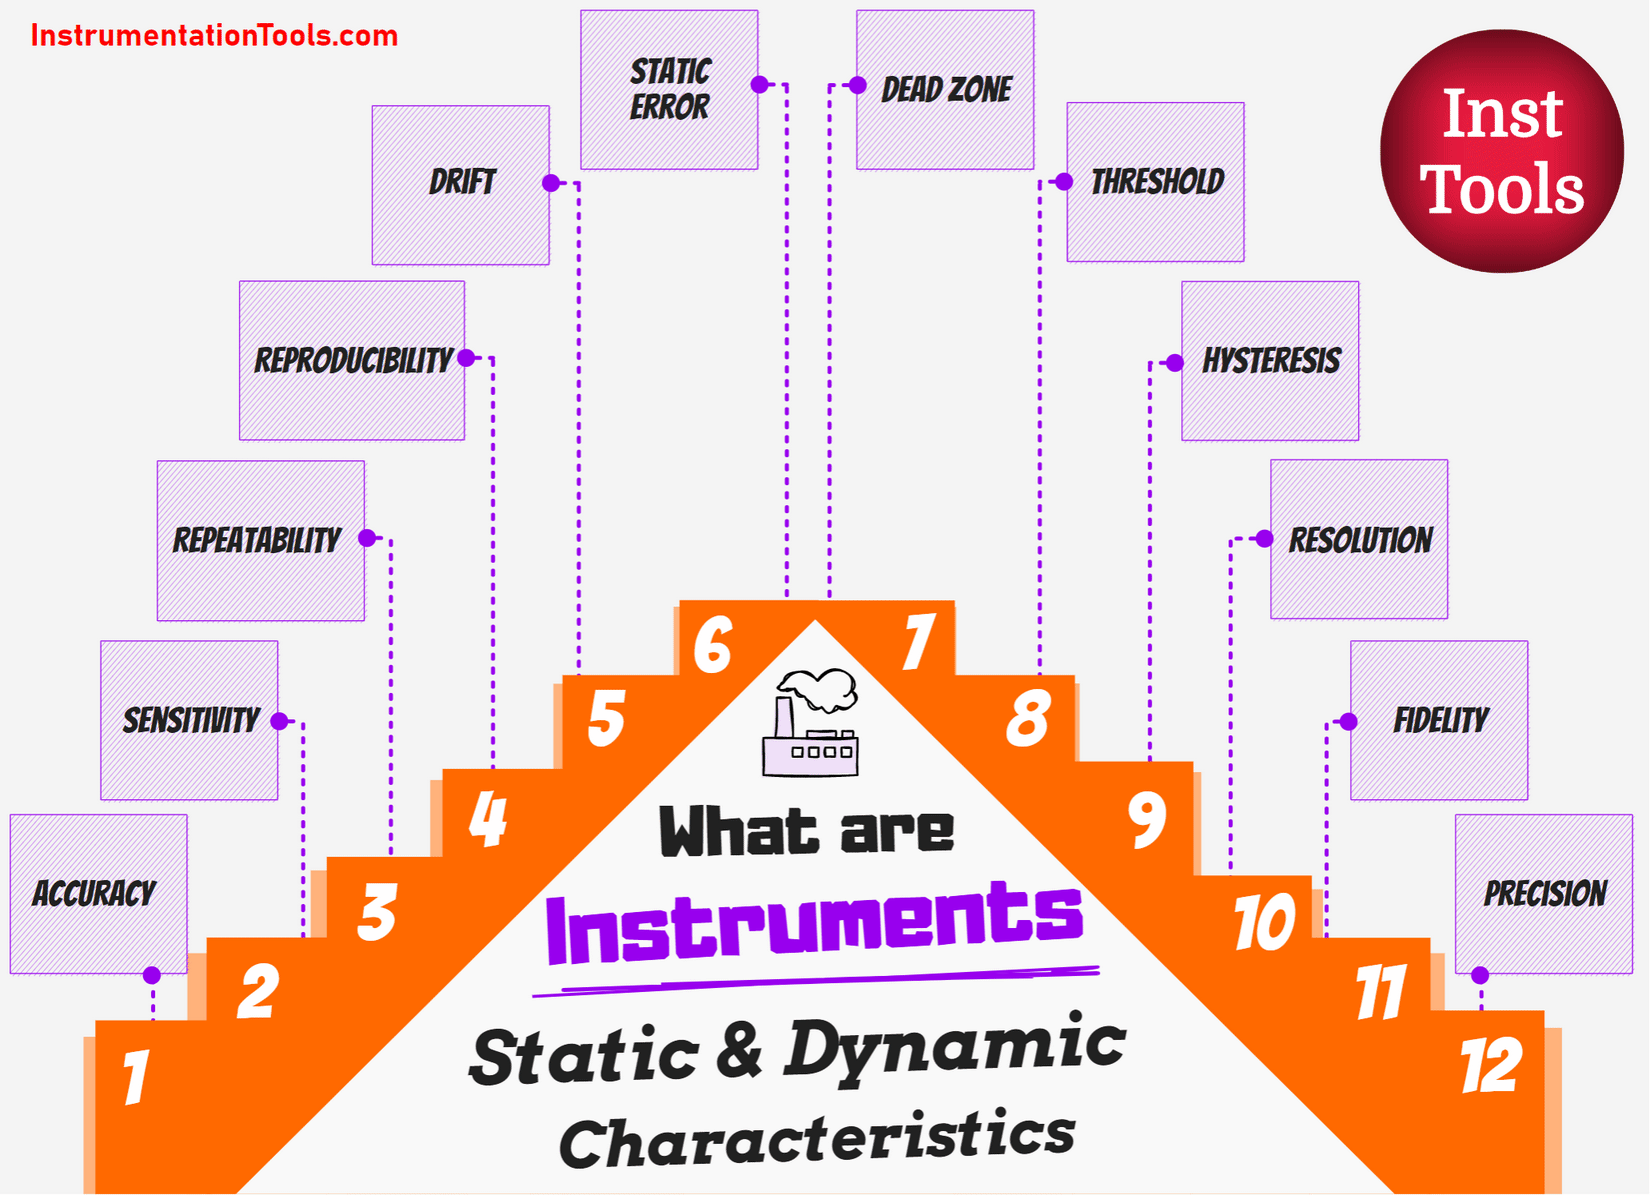
Static Characteristics of Instruments
Some of the static characteristics of instruments are Accuracy, Sensitivity, Reproducibility, Precision, Precision Error, Drift, Static Error, Dead Zone, Hysteresis, and Resolution,
Accuracy
- Accuracy is defined as the degree of closeness at which the instrument reading approaches the true value of the quantity to be measured.
- Due to the effects of temperature, humidity the measured quantity varies from the true value
- Accuracy is expressed in the “Percentage of Full-Scale Reading”, for instruments having a uniform scale.
- Specifying accuracy in terms of the percentage is better for the quantity being measured.
Sensitivity
- In steady-state conditions, Sensitivity is defined as the ratio of a change in output to a change in input.
- For a given instrument, sensitivity can be derived as the smallest change in the measured variable
- Sensitivity describes the maximum change in an input signal that will not initiate on the output.
- Note: The sensitivity of the instrument should be high.
Reproducibility
Under variable operating conditions, if the successive measurements produce agreed results for the same variables is called Reproducibility.
Precision
- Precision is the degree of exactness of the designed instrument.
- Precision is composed of two characteristics such as conformity and significant figures.
- With more significant figures, estimated precision is more.
- For example, consider two resistors of 1792 ohms and 1710 ohms, the continuous repeated measurement indicates 1.7 K ohms so an operator is unable to notify the true value from the scale.
Precision Error
- The precision error generated by the limitation of a measuring instrument.
- Since an operator evaluates a consistent reading of 1.5 K ohms, which is close to the true scale though there is no deviation from the observed value.
- The above example indicates that conformity is required because of the lack of significant figures obtained.
Drift
- Drift is defined as an unexpected change in the output of a measured variable over some time unrelated to a change in output operating conditions.
- Drift is caused by environmental factors such as mechanical vibrations, temperature variation, stray electric fields, stray magnetic fields, and thermal EMFs.
- A drift in instrument calibration occurs due to the aging of parts.
- Drift in flow measurement occurs due to wear and tear of primary sensing elements such as orifice plates.
- Adrift in temperature measurement occurs due to scale formation on the thermowell.
- Drift in Thermocouples or RTD occurs due to the change of metallic properties of elements.
- For a measuring device, drift can be systematic or random, or sometimes both.
- Flow drift occurs systematic way because of wear and tear in the edge of an orifice plate
Drift is further classified as:
- Zero Drift: Zero drift is defined as the deviation in the measured variable starting right from zero in the output with time.
- Span Drift: The Span Drift is defined as a proportionate change in indication along the upward scale, this span drift or also known as sensitivity drift.
- Zonal Drift: Zonal drift is defined as the drift that occurs at a certain portion of the span of an instrument.
The mechanical weighing scale is a common example.
If a person weighing 62 KGs stands on the scale then the scale displays 63 KGs. It is quite natural to notice a reading of 1kg for an empty scale.
Static Error
- Static Error is the variation between the true values of a measurable quantity to the values indicated by the measuring instrument which are not affected by operating conditions.
- Static error = True value of a measured quantity – Indicated Value.
- If the Static error is +ve, it means the instrument reads a high value.
- If the Static error is -ve, it means the instrument reads a low value.
Dead Zone
- For the largest range of values of a measured variable, to which the instrument does not respond.
- The dead zone occurs in indicating an instrument due to static friction.
- Due to this static friction a control valve doesn’t open for large signals from the controller.
Hysteresis
- Hysteresis is a phenomenon that defines various effects of output during loading and unloading.
- Generally, an instrument may indicate one set of output values for increasing input values of an instrument,
- It may indicate a different set of output values for the decreasing input values of an instrument.
- The maximum variation is observed at 50% of the full scale for increasing and decreasing inputs.
Resolution
- Resolution is the smallest quantity that can be detected with certainty by an instrument being measured.
- If a non-zero input quantity is raised slowly, the output will not rise until some minimum changes in the input are done. This minimum change causes the change in output to be termed resolution.
Dynamic Characteristics of an Instrument
Some of the dynamic characteristics of instruments are Dynamic Error, Response Speed, Fidelity, Lag, Retardation Lag, and Time Delay Lag.
Dynamic Error
Dynamic Error is the variation between the true values of a measurable quantity to the values indicated by the measuring instrument which are affected by operating conditions.
Response Speed
- Response Speed is defined as the rapidity of the instrument to responds to the changes in the measuring variable.
- It indicates how active and fast the system is.
Fidelity
Fidelity is defined as the degree to which a measuring instrument reproduces change in input faithfully without any dynamic error
Lag
- The lag time is taken by the system to respond, since every instrument takes at least some time to respond, whatever time it may be to the changes in the measured variable.
- For Example Lag occurs in temperature measurement by temperature sensors such as Thermocouples or RTD or dial thermometers due to scale formation on the thermowell due to the process fluid.
Retardation Lag
The response of the measurement begins immediately after the change in measured quantity has occurred.
Time Delay Lag
In this case, after the application of input, the response of the measurement system begins with some dead times.