 |
| Basics of Gas chromatograph Working Animation |
Overview
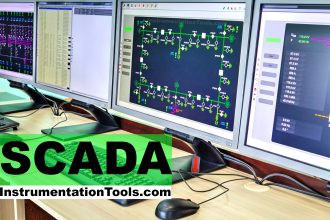
Gas chromatography is one of the most widely used techniques for analyzing hydrocarbon mixtures. Some of the advantages of chromatography are the range of measurement (from ppm levels up to 100 %), the detection of a wide range of components, and the repeatability of the measurements. Chromatography is used in the laboratory, in permanently installed online systems, and in the field with portable systems. No matter the location, style, or brand, all gas chromatographs are composed of the same functional components: the sample handling system, the chromatograph oven, and the controller electronics (refer to below Figure).
This post will cover the principles of sample handling, how chromatograph columns separate the components, why and how multi-port analysis valves are used, the common detector type used in the hydrocarbon applications, and the analysis processing that provides the component concentrations and the other calculated values (such as heating value and specific gravity) through physical reports or interfaces to other devices.
 |
| Working Principle of Gas chromatograph |
Sample Handling System
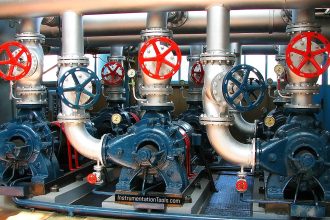
The gas chromatograph uses very small diameter gas paths and significant restrictions to flow; therefore, the sample injected to the analyzer must be dry and free of solids. Additionally, the gas chromatograph requires samples to be injected at a pressure significantly different than the source of the sample. The sample handling system should control the sample pressure and remove solid and liquids to ensure the sample presented to the gas chromatograph is clean and dry. The stream selection on multi- stream applications is also a function of the sample handling systems and is usually performed by simple solenoid valves.
Also See: Gas Chromatograph Working Animation
Most gas chromatographs require the sample to be controlled typically to between 15 and 30 PSIG (100 and 200 kPaG). In the majority of applications, the sample will be at considerably higher pressures, so the sample pressure must be regulated down to within the acceptable range.
Thompson effect in which the temperature of a gas will decrease as the pressure is reduced. Whereas the amount of cooling is dependent on the composition of the gas, a typical value used.for estimating the cooling of natural gas is seven degrees Fahrenheit per 100 PSI (American Gas Association, n.d.) or 5.6 °C per 1000 kPa. As the temperature of a hydrocarbon gas mixture is reduced, eventually some of the larger hydrocarbon components will begin to drop out of the gas phase into the liquid phase. The temperature at which this begins to occur is the hydrocarbon dew point. If the sample is near the hydrocarbon dew point when it is sampled, the temperature of the gas may drop below this point when the pressure is regulated down, and the composition of the gas will change as the heavy components drop out as liquids.
The goal of the sample handling system is to preserve the composition of the gas, so it is important to consider the detrimental effects that the Joules-Thompson effect may have on the sample.
The use of heated regulators, insertion regulating probes (which use the heat from the flowing gas in the pipeline to maintain the temperature of the regulated sample), and heated sample handling components such as heat-traced tubing is highly recommended to ensure that the temperature of the sample is maintained to at least 30 °F (16.7 °C) above the hydrocarbon dew point (American Petroleum Institute, 2006).
Inline filters are typically used to remove solid particles down to two- microns in size. The larger the volume inside the sample handling system, the longer the lag time between when the sample enters the probe and when it enters the gas chromatograph. To avoid introducing large sample lag times into the system, particulate filters should not have large volumes, so coalescing filters are generally not recommended.
Many sample probes in use today include a particulate filter at the filter tip. These are highly recommended as they stop contamination entering the system; however, users must routinely remove the probe and replace the filters to ensure the sample flow through the filter/probe is sufficient.
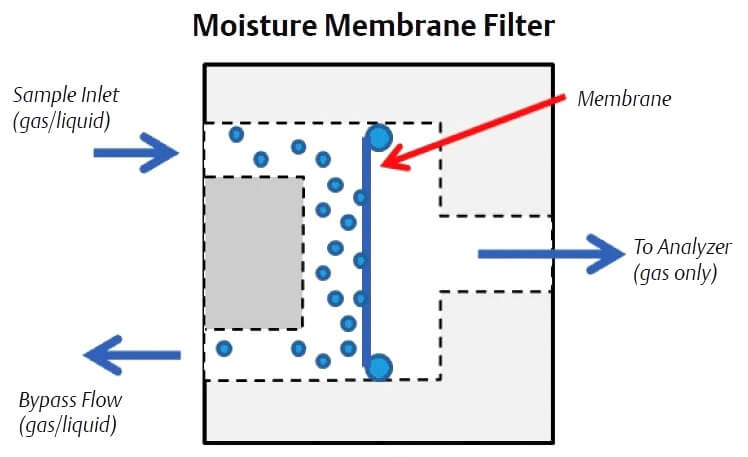
Liquids can be removed using membrane filters that use a specially designed membrane that only permits gas to pass through. The membrane can be located on the probe tip or in a membrane filter/ separator located on the gas chromatograph sample handling system. The typical liquid membrane filter passes the sample gas through the membrane and sweeps the removed liquids away through a bypass flow path. The bypass flow also allows the sample lag time to be reduced as it provides for a faster flow rate from the probe to the analyzer sample handling system (up to 500 cc/min) than the flow rate into the gas chromatograph, which is typically 30 cc/min to 50 cc/min.
Chromatograph Oven
The analytical components of the gas chromatograph (the columns, valves, and detectors) are enclosed in a heated oven compartment.
The performance and response of the chromatograph columns and the detectors are very susceptible to changes in temperature, so the oven is designed to insulate these components from the affects of ambient temperature changes and maintain a very stable temperature internally. A gas chromatograph’s performance is directly correlated to the temperature stability of the columns and detector, so the temperature control is typically better than ± – 0.5 °F (± – 0.3 °C)
The temperature at which the oven is controlled is dependent on the application: the heavier the expected hydrocarbon mixture, the hotter the oven temperature. Natural gas applications have a typical oven temperature setting of around 176 °F (80 °C). The temperature of the oven is typically set in the factory and is rarely adjusted in the field.
Chromatograph Columns
The heart of the gas chromatograph is the chromatograph columns. The columns separate the gas mixture into its individual components using some physical characteristic. In the case of most hydrocarbon applications, “boiling point” columns are used and separate the components by their individual boiling points; however, other applications may use molecular size (molecular sieve columns) or polarity differences to achieve the separation.
Chromatograph columns are constructed by packing a tube with column packing material. The material is held in place by sintered metal filters at either end of the tube. The packing material consists of very small support material that has a very thin coating of liquid solvent. This is called the stationary phase.
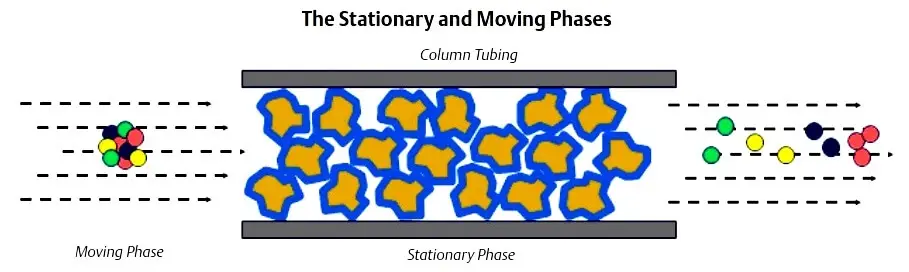
The sample gas is carried through the columns by the carrier gas. The combination of the carrier gas and the sample gas is called the moving phase. The carrier gas is a gas which is not a component of interest (it is not being measured) and acts as a background gas that permits the easy detection of the components being measured.Typically, helium is used for hydrocarbon applications; however, hydrogen, argon, and nitrogen are also used, depending on the application.
As the gas sample moves through the column, components with lower boiling points move more slowly than the components with higher boiling points. The speed at which this separation occurs is dependent on the temperature of the column. The length of the column determines the amount of separation of the components.
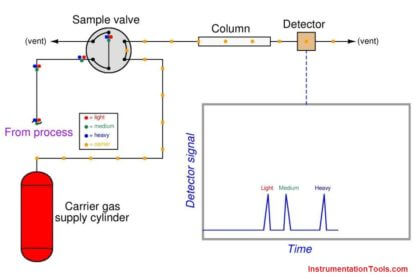
Theoretically, a single column could separate all of the components of interest in a sample; however, the column would be very long, and the analysis time would be longer than 30 minutes. To accelerate the analysis time to a more practical time, multiple columns are used to split the analysis into smaller and faster column applications. In a typical four-minute C6+ three-column arrangement (refer to below Figure under Analysis Valves topic), column one separates the hexanes and heavier components (the C6+ components) from the pentanes to methane hydrocarbons, nitrogen, and carbon dioxide. Column two then separates normal-pentane, iso-pentane, neo-pentane, normal-butane, and iso-pentane, while allowing the nitrogen, methane, carbon dioxide, and ethane to pass on to and be separated by column three.

Analysis Valves
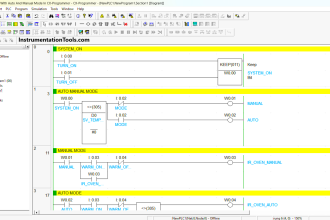
The injection of sample into the analyzer (the sample valve) and the switching of the analytical flow paths to enable the use of multiple columns are achieved using specialized analysis valves. Analysis valves come in either six-port or ten-port configurations with very low internal volumes to avoid any dead volumes and to allow precise switching between components as they leave the columns. As the analysis valves are located inside the oven compartment, they are pneumatically operated through three way solenoids mounted outside of the heat-controlled zone of the oven. In some applications, the carrier gas is used as the actuation gas; however, clean and dry air or nitrogen also can be used to reduce expensive carrier gas usage.
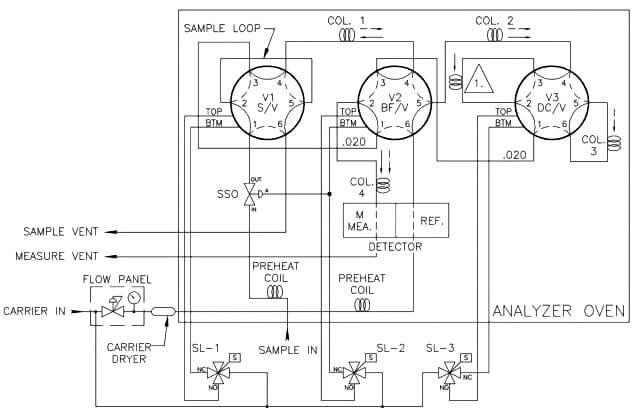
The sample valve is used to inject a repeatable volume of sample into the analytical flow path at the beginning of the analysis cycle. Before the sample injection, the sample loop is flushed with new sample (refer to Figure 5). To ensure the physical amount of sample is the repeatable from one analysis cycle to the next and is not affected by sample pressure, the sample flow is stopped for a short time before the sample injection using a sample shut-off valve, and the sample loop is allowed to equalize to atmospheric pressure via the sample vent.
To inject the sample into the analytical flow path, the sample injection valve is actuated and the carrier gas is switched so as to push (or “carry”) the sample out of the sample loop and into the first column (refer to Figure 6).
Two very common column switching techniques are used with multiple column gas chromatographs: the back-flush and the dual- column arrangement. The back-flush arrangement (refer to Figure 7) is used to separate the individually measured components from the heavy components which are sent to the detector as a single peak (such as the C6+ peak). The sample is pushed through the back-flush column until the last of the lighter components has left the back- flush valve, but before any of the back-flushed componentshave left the column. The back-flush valve is then actuated and the carrier gas direction through the column is reversed so that the heavy components (which have been partially separated in the column) are recombined into a single peak (refer to Figure 8).
 |
| GC Column Working Principle |

 |
| GC Detector Working Principle |
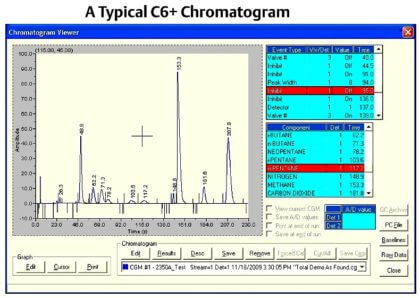 |
| Chromatogram |
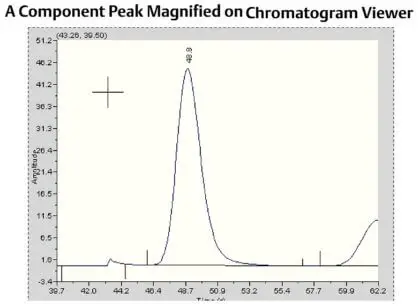 |
| Chromatogram Viewer |
Conclusion


Such details regarding gas chromatography is amazing. The details from the basics i.e it is used for analizing Hydrocarbon contents in a sample to its animation is productive.
what is low heat value on gc and what is ob equation on GC please explain that.
this is very interesting science, but we can not copy it
please help me how can i copy and paste it
Please live video for Siemens GC Mod 50 valve samples Transportation video in on/off position.