For Safety Instrumented System (SIS) – The probability of Failure on Demand (PFD) calculation is carried out as part of the SIS design after the LOPA/PHA study.
SIS PFD
Probability of Failure is a calculated term based upon reliability data, which reflects the possibilities or likelihood of an SIS failing to operate.
Typically expressed as Probability of Failure on Demand (PFD), this term is important in determining design configuration and test intervals.
Probability of Failure on Demand (PFD)
This topic covers the definition of PFD, different calculation methods, and the important variables in the equations.
The higher the SIL, the lower the expected PFDavg for demand mode or the lower the average frequency of a dangerous failure causing a hazardous event
The required SIL shall be derived taking into account the required PFD
Overall SIS should achieve the target probability of failure on demand (PFD) for a demand mode system (viz. continuous mode of operation), it should achieve the target frequency of failure necessary to meet the calculated Safety integrity level.
What is PFD?
PFD is the probability that a system will fail to perform a specified function on demand. It shall be equal to (or less than) the target failure measure as specified in the Safety Requirements specifications.
PFD is the function of device failure rate (Dangerous Undetected) Vs. Time
PFD(t) = 1 – e(-λDU*t)
λDU – Dangerous Undetected failure rate
t – Time in years
PFD – Probability of Failure on Demand
“As time increases failure probability also increases”
As PFD is a mathematically calculated figure over no of years it is preferred to calculate the average PFD,
PFDAVG = λDU *Ti/2 (For 1oo1 configuration), this formula varies according to the instrument configuration.
Most safety instrumented functions operate in the Low Demand Mode. These SIS are normally not taking any action, but are available when needed.
For a SIF to meet the “low demand mode” definition the specific SIF demand must occur less often than once a year AND at least 2 proof tests must be conducted between demands.
PFD is the appropriate failure measure for SIFs in the Low or High Demand Mode.
Safety Integrity Requirements – PFDAVG for Continuous mode of operation.
| Safety Integrity Level (SIL) | PFDAVG | Required Risk Reduction |
|---|---|---|
| 4 | ≥ 10−5 to < 10−4 | > 10,000 to ≤ 100,000 |
| 3 | ≥ 10−4 to < 10−3 | > 1,000 to ≤ 10,000 |
| 2 | ≥ 10−3 to < 10−2 | > 100 to ≤ 1,000 |
| 1 | ≥ 10−2 to < 10−1 | > 10 to ≤ 100 |
The average frequency of Dangerous failures of SIF (Continuous/Demand mode of operation)
| Safety Integrity Level (SIL) | The average frequency of Dangerous failures per hour |
|---|---|
| 4 | ≥ 10−9 to < 10−8 |
| 3 | ≥ 10−8 to < 10−7 |
| 2 | ≥ 10−7 to < 10−6 |
| 1 | ≥ 10−6 to < 10−5 |
How PFD is Calculated?
PFD is basically calculated using a method as per the IEC-61508 standard.
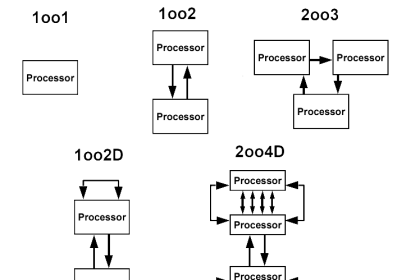
Calculated PFD takes into account the architecture of the SIS (e.g. 1oo1, 1oo2D), the estimated dangerous failure rate of each subsystem (e.g. sensors), common cause, diagnostic coverage, proof test intervals, and repair times.
Requirements of PFD in Complex Cases
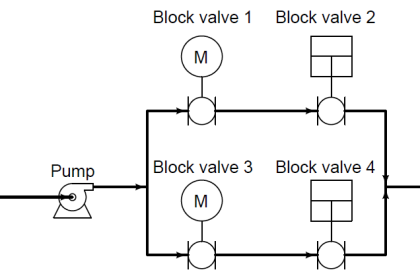
Calculating PFD for most common valve (Like 2 valves in Series – 2oo2; 2 valves in parallel –twice 1oo1) configurations can be calculated using the available tools by certifying agents such as Exida.
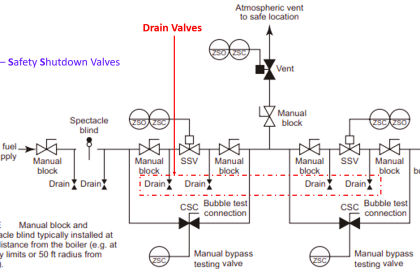
Under some circumstances, quite complicated configurations arise, for example, when multiple feed lines feed a reactor or Multiple valves lined up for a furnace/boiler.
In these cases, some simplifying assumptions can be made and stepwise PFD calculations are done to determine the test frequency for the multiple valve configurations.
A more sophisticated evaluation using Fault Tree Analysis (FTA) is an option
PFD budget
The probability of failure of an SIS loop is really the sum of the probabilities of failure of the individual components – namely the sensor(s), logic solver, and final element(s).
PFD (Total) = Sum of (sensors PFD + Logic solvers PFD + Final control elements)
Weightage factors
- Sensor – 35%
- Logic solver – 15%
- Final control element – 50%
By standard followed under many industrial conventions, the portion of the overall failure probability is normally “budgeted” to the individual components in the following way: 35% sensor, 15% logic solver, and 50% final element.
Analysis and Industrial experience have shown that historically 50% of the time that an SIS fails it is due to a failure in the final element (and 35% of the time the failure reason is caused by a failure in the sensor, and 15% of the time the logic solver is at fault).
Therefore, when we design an SIS, we “design” the SIS final element PFD to be 50% of the required total loop PFD. In certain cases, the budget for sensors could go as high as 50% for sensors, or as high as 70% for final elements.
Finally the total sums of individual PFDavg to 100%.
Factors affecting PFD
The below table shows the impacting factors of the Probability of Failure on Demand and methods to improve them.
| S.no. | Impacting factors of PFD | Methods to improve |
|---|---|---|
| 1 | Configuration of the SIS (e.g. 1oo1, 1oo2D) | Recommended to give with Diverse instruments where possible – to maximize the reliability in a Redundant configuration |
| 2 | The estimated rate of failure of each subsystem (i.e. sensors, logic solvers, final elements) | Calculations to take care for 50% as Safe failure 50% as Dangerous failure |
| 3 | Susceptibility of the SIS to common cause failures Common cause Beta factor has a large effect on PFD | Avoid common impulse lines, 2 or 3 transmitters in the SIS loop to be wired to individual cards to overcome the failure of common Analog input module |
| 4 | Diagnostic coverage | Wherever possible install Smart instruments that can detect internal electronic failures and communicate these problems to the Control room. This can decrease the SIS’s failure probability providing operations to act swiftly on the notification in a timely manner |
| 5 | Proof test intervals | Testing the SIS components frequently will find potential problems and decrease the SIS’s failure probability |
| 6 | Repair times | With redundant sensors, repairing a faulty sensor quickly will result in less time that the SIS is operating at a reduced failure probability. Thus always Redundancy helps in meeting quick repair time and supports to improve PFD. |
| 7 | Mode of SIF operation | Most SISs operate in “continuous demand” mode. If something bad happens, the SIS takes action to prevent things from getting worse. In “continuous” mode, the SIS is the normal control, waiting to take action when there is a need arises in the process. |
| 8 | Estimate of dangerous failure rates (i.e. “safe failure fraction”) | If a sensor fails often, but virtually every time it fails to a safe state which activates the SIS, then the SIS will have a low failure probability |
Hence it is always required to do SIS design taking into consideration various factors such as PFD & apply the rules/requirements to improve the plant Safety as well as reliability.
If you liked this article, then please subscribe to our YouTube Channel for Electrical, Electronics, Instrumentation, PLC, and SCADA video tutorials.
You can also follow us on Facebook and Twitter to receive daily updates.
Read Next: