This article discusses how to use the Diagnostic Buffer feature in TIA Portal for quick PLC troubleshooting. The Diagnostic Buffer is an event log stored chronologically inside the CPU. It records every operating mode change (STOP, STARTUP, RUN), program error, I/O module fault, and cycle time violation, along with the date and time of occurrence. Its contents remain stored even when the CPU stops or the power is turned off, so engineers can trace what happened before and right after the CPU fault, without having to wait for the event to recur.
When the CPU suddenly goes to STOP, or the SF LED lights up, the Diagnostic Buffer is the first place to check. By reading it in order, we can distinguish the main cause (root cause) from derived events (consequences), and determine whether the problem lies in the program, hardware, or configuration.
In this article, the simulation uses PLCSIM Advanced V5.0 with a virtual S7-1500 CPU. 2 faults are created deliberately: an operating mode change and a CPU STOP caused by the STP instruction. From these two faults, we learn to read the buffer entries and find the source of the problem.
Prerequisites
- The reader already knows how to simulate an online program using PLCSIM Advanced.
- The reader already understands how to create a Global Data Block and an SCL program in OB1.
- The reader already understands how to go online and download a program to the PLC.
Siemens TIA Portal Diagnostic Buffer
As for how the Diagnostic Buffer works, the CPU records events automatically without needing any additional program. Events entering the buffer are divided into several groups:
- Operating mode changes: STOP, STARTUP, RUN, including the cause (operator command or an instruction in the program).
- Program errors: programming error, access error, and time error (cycle time exceeded).
- Hardware and network faults: module removed or defective, wire break, power supply problems, PROFINET station failed or restored.
- System events: program download, memory reset, firmware update, and configuration changes.
Simulation Preparation
Step 1: Project Configuration
- Right-click the project > Properties > Protection tab, then check Support simulation during block compilation.
- In the CPU properties, open Protection & Security > Connection mechanisms, then check Permit access with PUT/GET communication from remote partner.
Step 2: Running the Virtual CPU
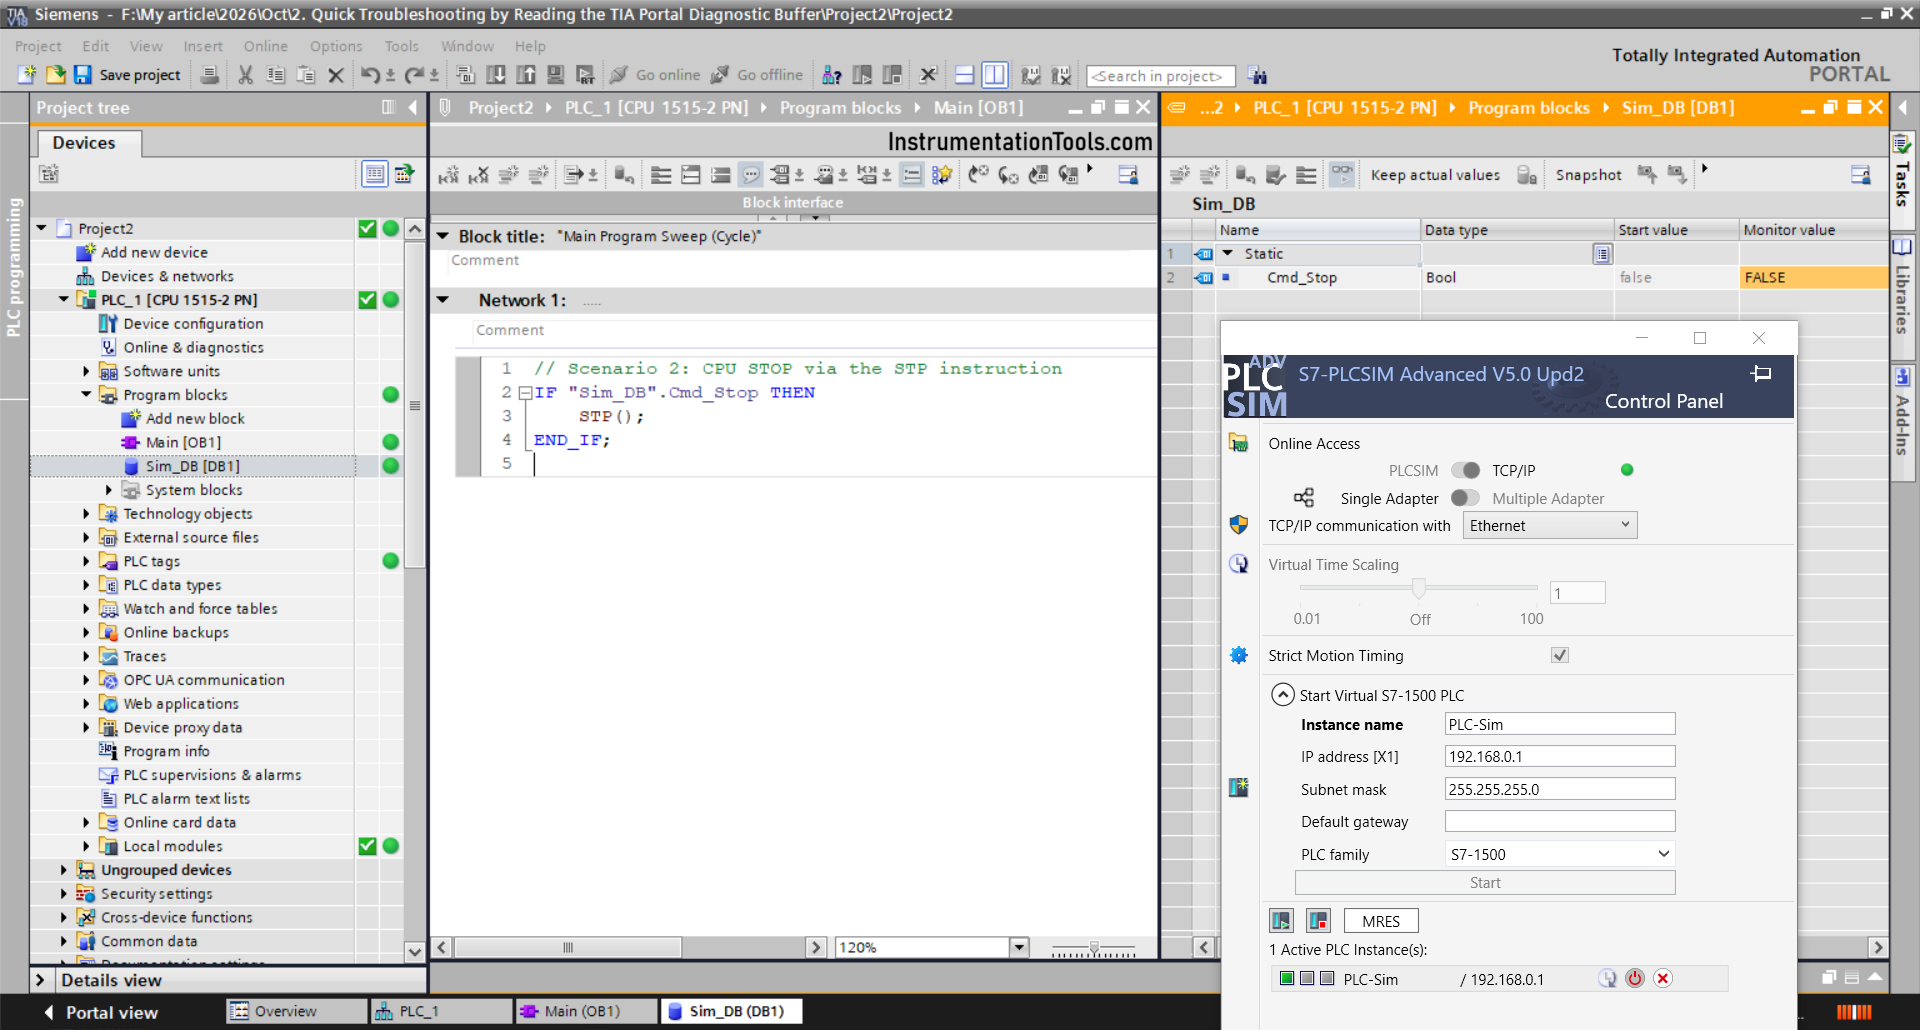
- Open PLCSIM Advanced, select PLCSIM Virtual Ethernet. Adapter under Online Access.
- Fill in the instance name, select PLC type: S7-1500, set the IP according to the CPU in TIA Portal, then click Start. Wait until the status is RUN.
Step 3: Creating the Test Program
- Create a Global DB Sim_DB (Optimized) containing Cmd_Stop (Bool).
- In OB1 (SCL), write the following program:
// Scenario 2: CPU STOP via the STP instruction
IF “Sim_DB”.Cmd_Stop THEN
STP();
END_IF;
- Compile, download to the virtual CPU, and make sure the status is RUN.
Opening the Diagnostic Buffer
- Click Go online, then in the Project Tree select the CPU > Online & diagnostics.
- In the left panel, open Diagnostics > Diagnostic buffer.
- The window is split into two: the Events list at the top and Details on event at the bottom.
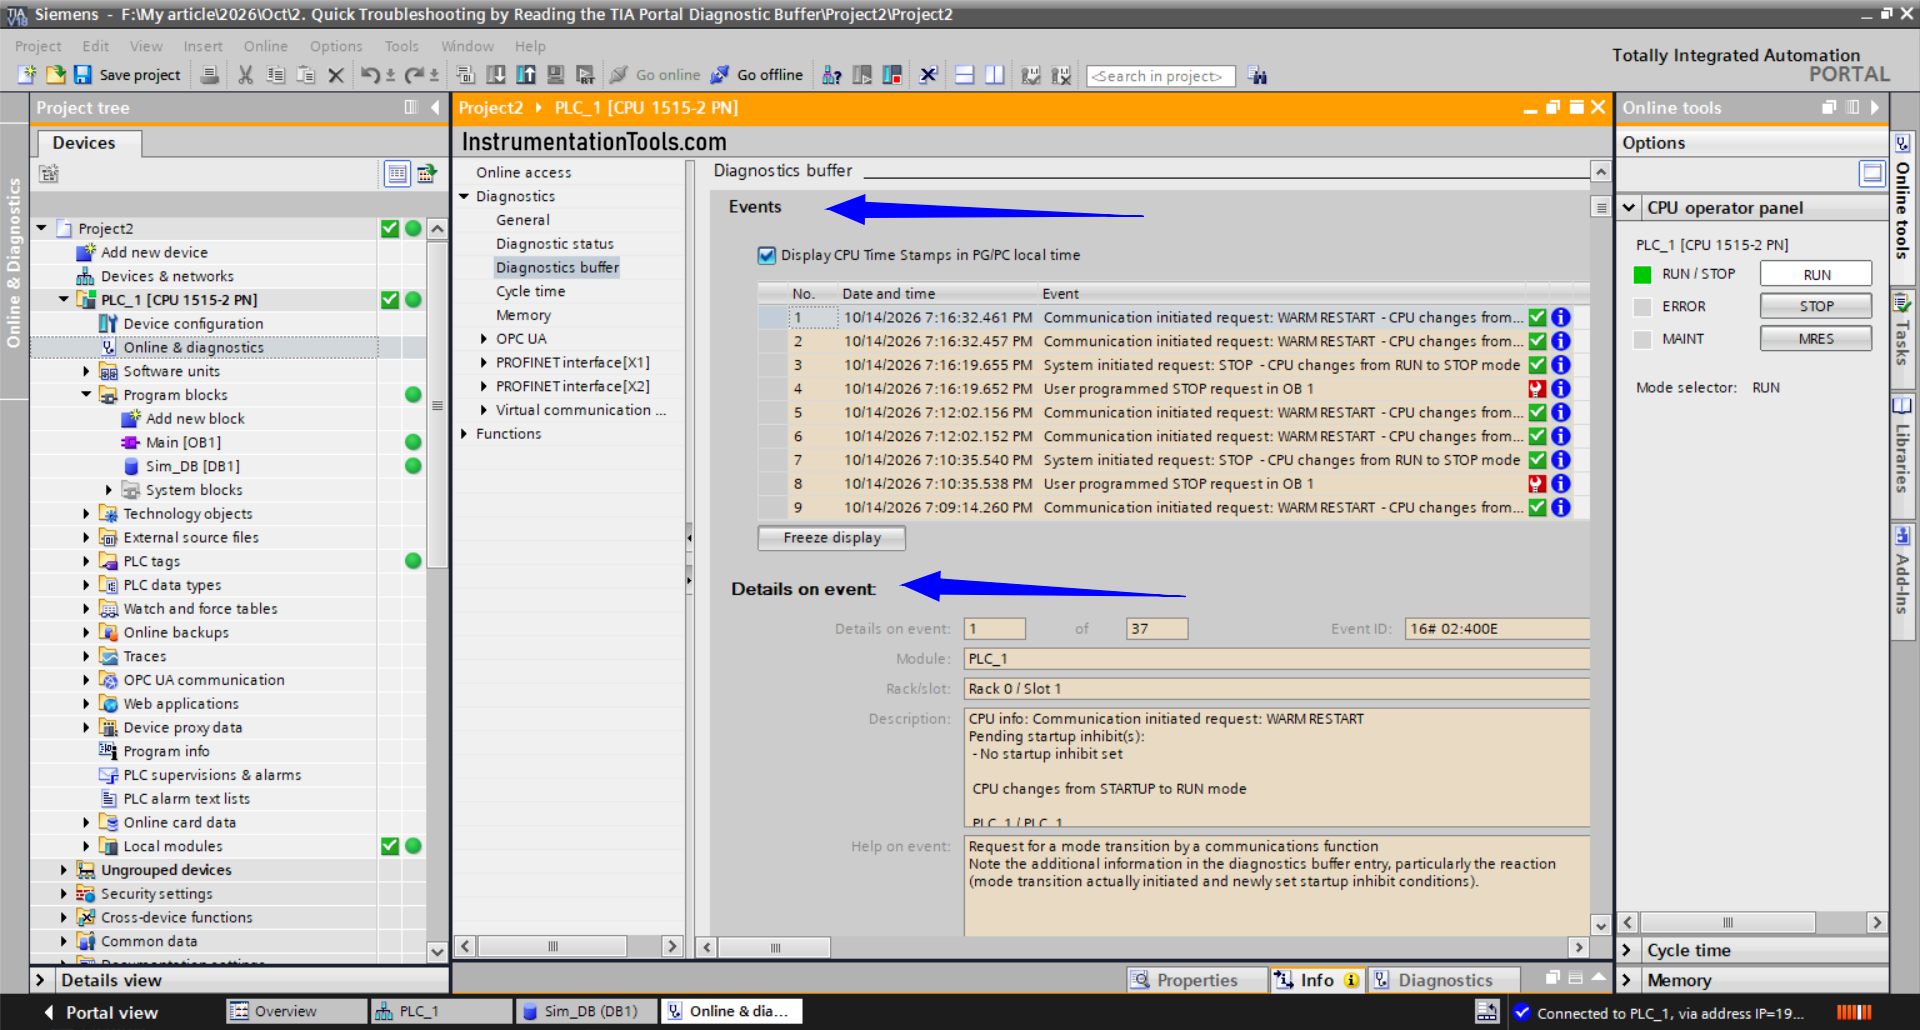
Functions you need to know:
- Freeze display: freezes the list so it does not shift when new entries arrive.
- Save as: saves the buffer contents to a file. Do this before resetting the CPU.
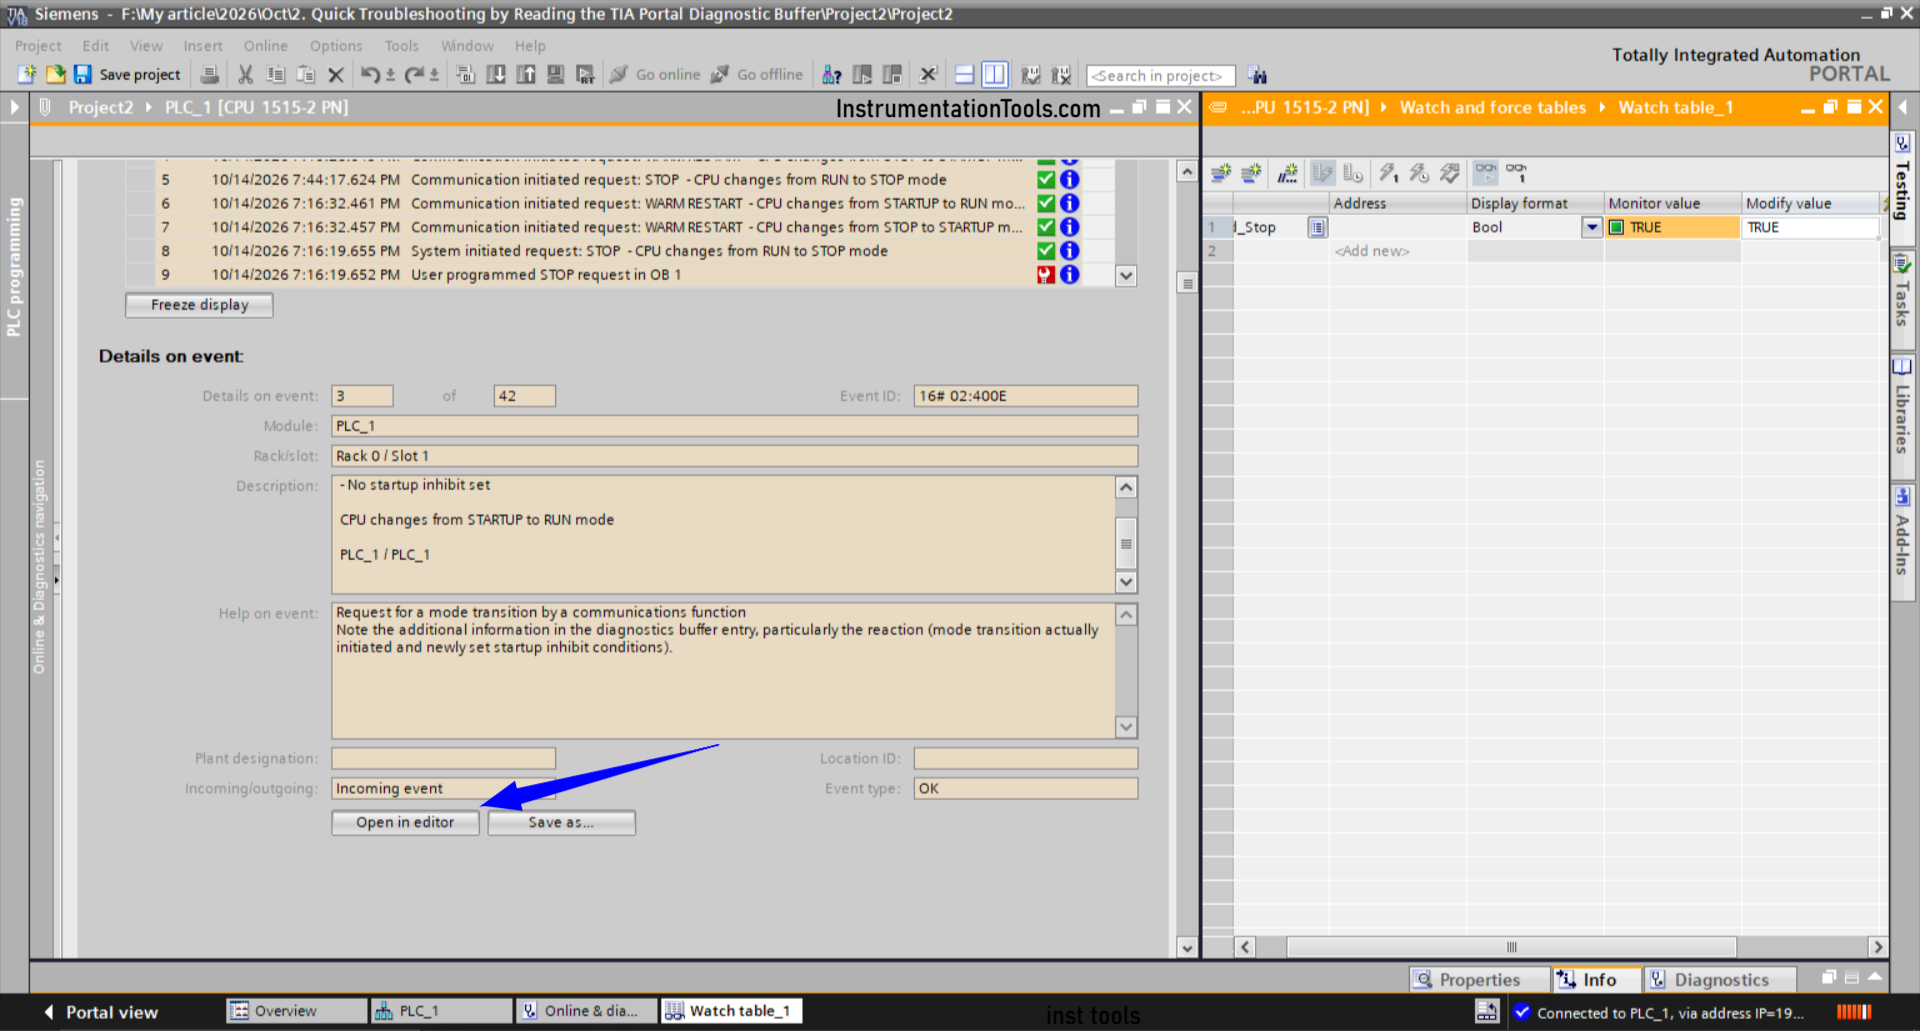
- Open in editor: jumps to the block related to the event (if available).
How to read: the newest entries are at the top, so to trace cause and effect, read from bottom to top. Look for the first abnormal entry, because the entries after it are often just consequences (for example, the CPU switching to STOP).
Simulation Scenarios
Scenario 1: Operating Mode Change
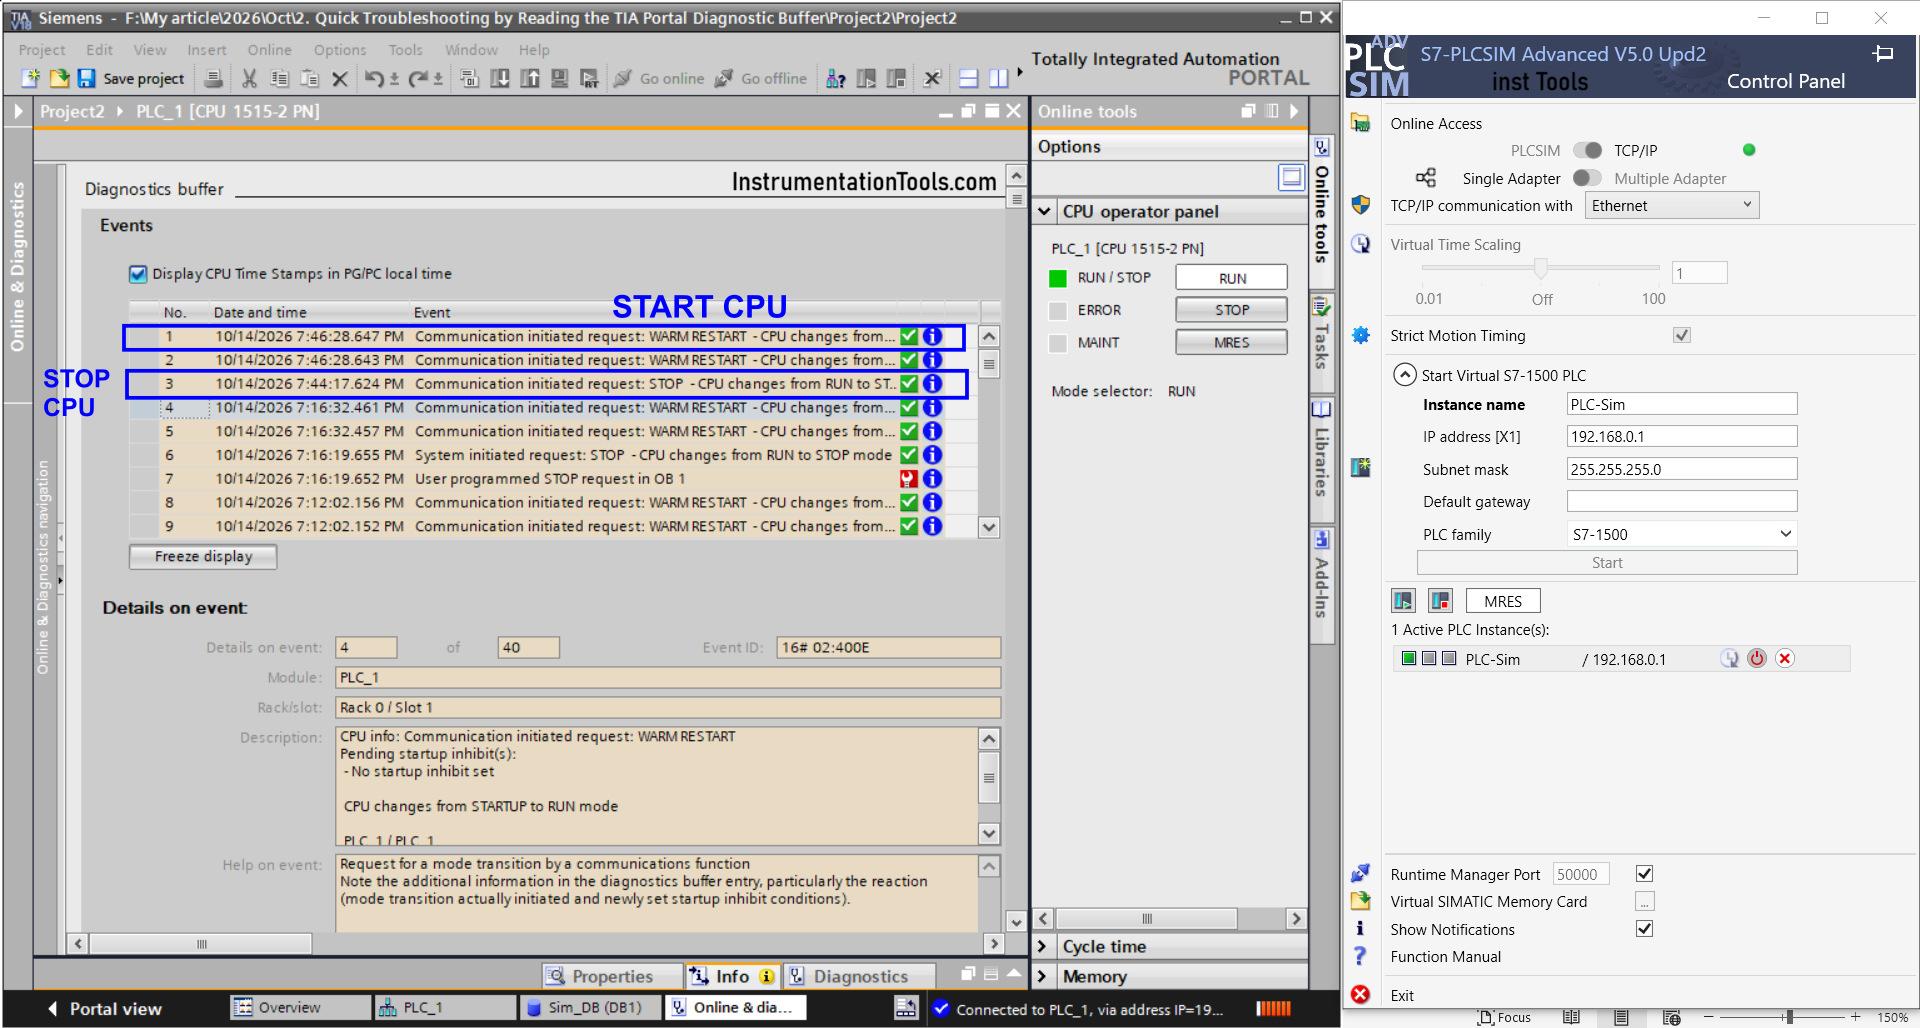
- In PLCSIM Advanced, click STOP, wait a few seconds, then click RUN.
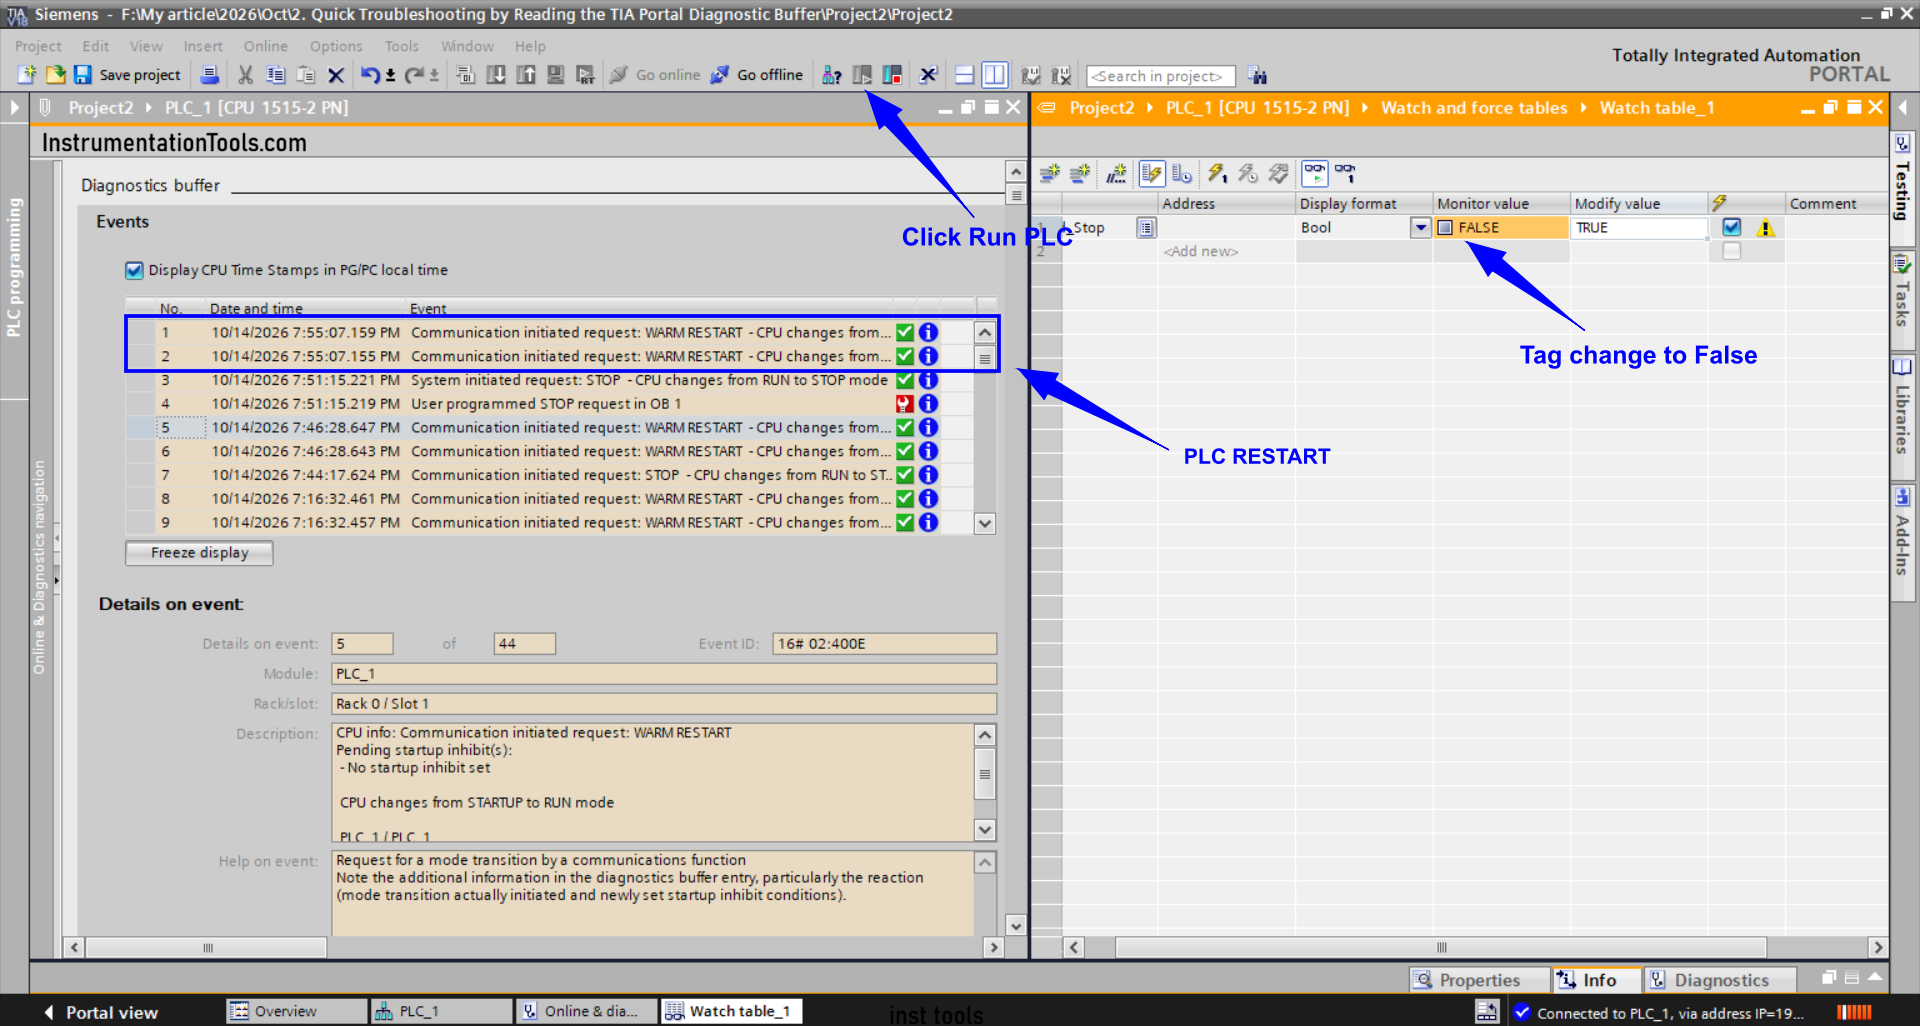
- Open the Diagnostic Buffer. Mode change entries appear: RUN to STOP, STOP to STARTUP, then STARTUP to RUN.
- Function: distinguishes a CPU that stopped because of an operator command from one that stopped because of an error.
Scenario 2: CPU STOP by the STP Instruction
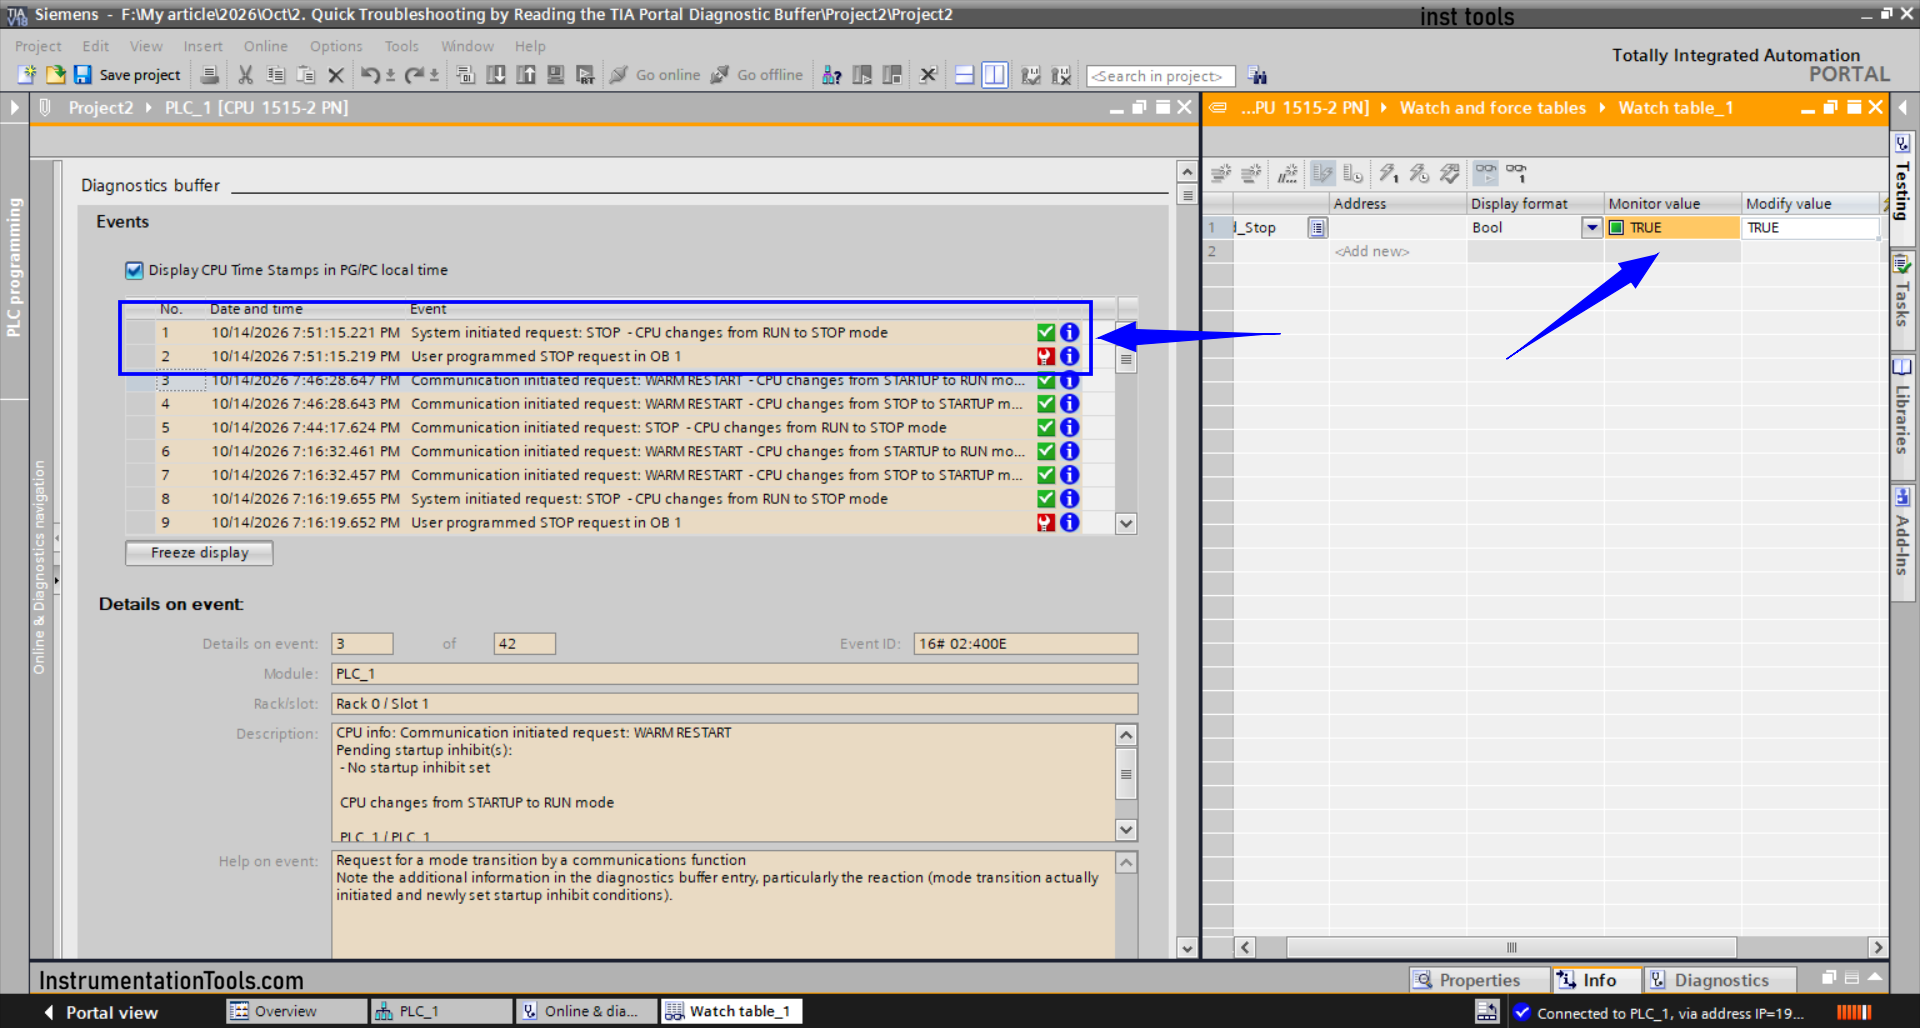
- Change Sim_DB.Cmd_Stop to TRUE via the Watch table. The CPU will go into STOP mode.
- Open the Diagnostic Buffer. The top entry records the CPU STOP caused by the STP instruction along with the time of occurrence.
- Select that entry, then click Open in editor to go to the block containing STP.
- Recover by setting the CPU to RUN. Non-retentive variables return to their start values, so Cmd_Stop becomes FALSE.
- Function: ensures the STOP originates from program logic, not hardware.