In this article, we will learn about sensors and transducers and their performance characteristics & their features with examples.
Sensors and Transducers
A transducer is a device that converts one form of energy/signal to another form of energy/signal. For example, conversions of variations in physical quantity such as force, torque, light, motion, position, etc.
Typical applications are in automation, control systems and they measure to convert physical parameters such as pressure, temperature, level, flow or brightness, etc., into an electrical signal or vice versa.
The term Transducer is often used in place of the term sensor. Transducers are defined as elements that when subject to some physical change experience a related change.
A sensor is a device that can be used for measuring the physical quantity and converts it into signals that can be read by a user, an observer, or by an instrument.
The term sensor is used for an element that produces a signal relating to the quantity being measured. In the case of an electrical resistance temperature element, the quantity being measured is temperature and the sensor transforms an input of temperature into a change in resistance. Thus, Sensors are Transducers. A measurement system may use transducers in addition to the sensor, in other parts of the system to convert signals from one form to another form.
Performance Terminology of Transducers
The following terms are used to define the performance of transducers:
Range and Span
The range of a transducer defines the limits between which the input can vary on the working. The Span is the difference between the maximum value and the minimum value.
For example, a load cell for the measurement of forces might have a range of 0 to 50kN and its span is 50kN (50 kN – 0 kN = 50kN).
Error
Error is the difference between the result of the measurement and the true value of the quantity being measured.
Error = measured value – true value
For example, measurement system gives a temperature reading of 50℃ , but the actual reading is 49 ℃, then the error is +1℃ (50℃ – 49℃). If the actual reading is 52 ℃ , then the error is -2℃ (50℃ – 52℃). The error can obtain in both positive and negative values.
Accuracy
It is the extent in which the value indicated by a measurement system might be wrong. It is the summation of all the possible errors that are likely to occur as well as the accuracy to which the transducer has been calibrated.
For example, if the temperature of the system have a specified accuracy of ± 5℃, this means that the reading given by the instrument to be lie within plus or minus 5 ℃ of the true value.
Accuracy is mainly expressed in percentage of the full range.
For example, a transducer having an accuracy of ± 10% of full range output of 0 to 500 ℃, then the reading can be expected from plus or minus 50 ℃ of the true reading i.e., from 450 ℃ to 550℃.
Sensitivity
It is normally termed as the relationship showing how much output there is per unit input, i.e., output/input.
For example, a resistance thermometer has sensitivity of 1Ω/℃. This shows that the thermometer having sensitivity, where there is a deflection of 1Ω for every 1℃. This is also used to indicate the sensitivity to inputs other than being measured.
Hysteresis Error
Transducers can give different values of outputs to the same value of quantity being measured.
So the output value will be obtained by continuously increasing or continuously decreasing change. This effect is called hysteresis.
The difference between the decrease in change and increase in change on the system of measurement known as hysteresis error.
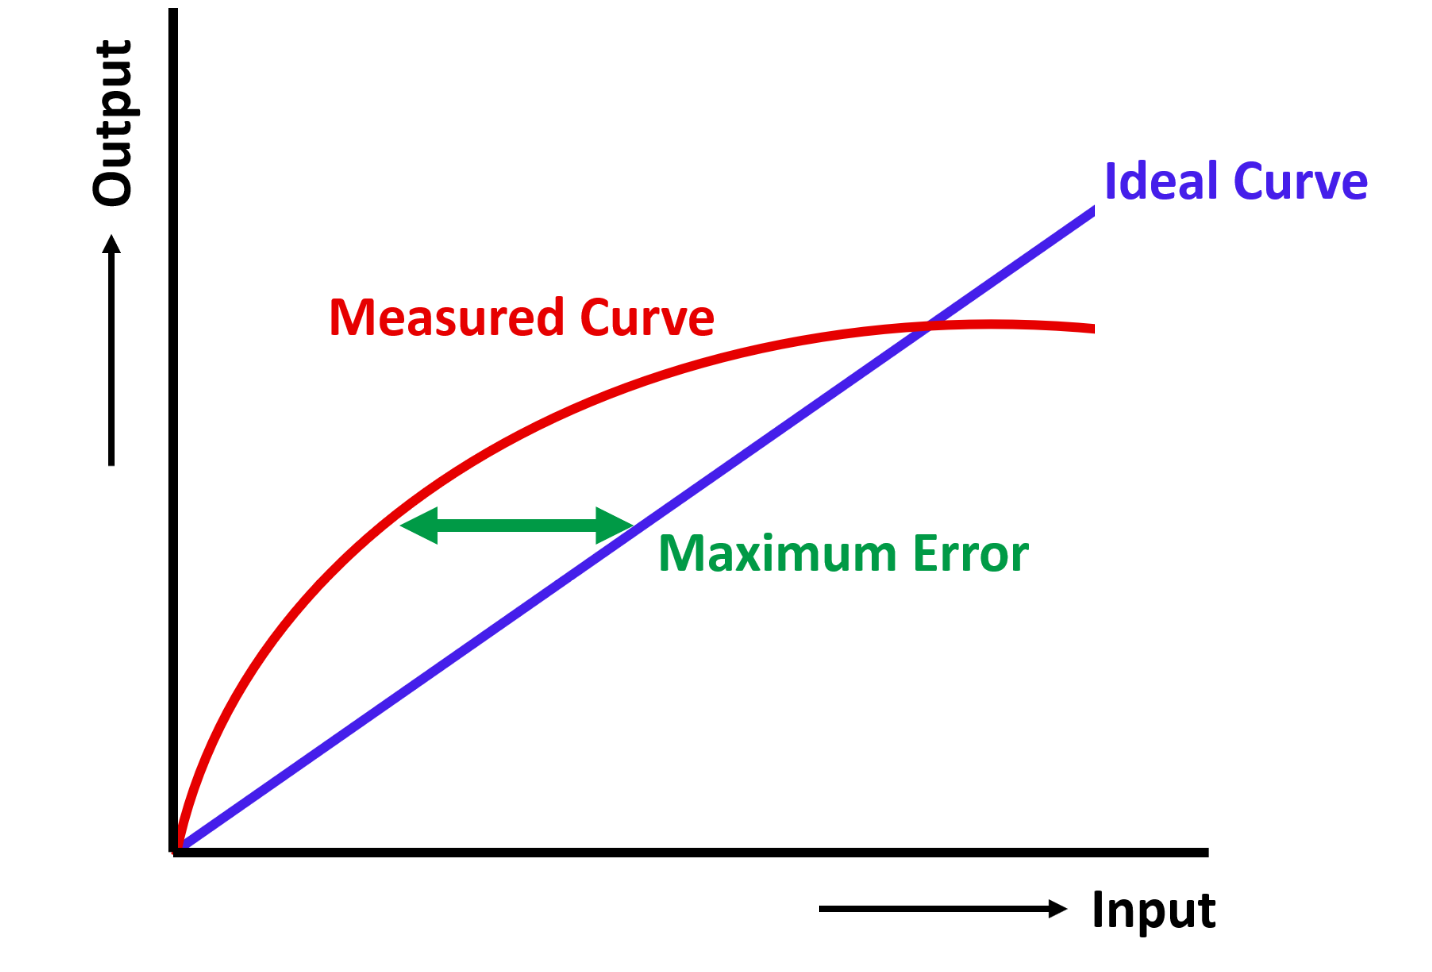
Non-Linearity error
In many Transducers linear relationship between the input and output is assumed over the working range. i.e., for the given input the obtained output will produce a graph of straight line.
But some times this linearity will not be occurred due to certain possible errors. The error is defined as the maximum difference from the straight line. It is known as Non-Linearity error. Various methods are used for the numerical expressions of the non-linearity error.
This error is generally defined by percentage of the full range output. We can identify the non-linearity error by observing the linear relationship of the input and output, plot them in a straight line on a graph.
Then the non-linearity function for the input and output also plot in the same graph. Surely, this non-linearity will not be in straight line. The difference between two graphs is called error (non-linearity error). Below image shows the graph of non-linearity error .
Repeatability/Reproducibility
Repeatability /reproducibility in transducer is defined as the ability to give the same output for the applications of the same input value.
The error occurring from the same output not given with repeated applications is usually expressed as a percentage of the full range output.
Repeatability = (max value- min value)/ full range * 100
For example, the maximum resistance measured in system of 100 ℃ is 75Ω and the minimum resistance is 0.1 Ω of the range (0 to 75 Ω), then the repeatability is calculated by
Repeatability = (75-0.1)/75 *100
Repeatability = 74.9/75 = 0.99 *100
Repeatability = 99
For the system the repeatability will be 99% for the same output value for the same input.
Stability
Stability of a transducer is the performance of a transducer which will give the same output when used to measure the same input for a period of time.
Normally, stability is nothing but for the constant given input the output will be stable only for given period of time in the measurement system.
Drift
The term drift is used to describe the change in output for a given period of time for the same input.
The drift may be expressed as percentage of the full range of output. There is a term called Zero Drift which is used to describe the change in output on the system when there is no input or zero input.
Dead Band
The dead band of a transducer is the range of input values in the system for which there will be no output.
For example , in a Load measurement system the change of resistance will define the amount of weight but if there will be no output for some range of input after that output will occur similarly.
The space / time where there is no output for the input is known as Dead Band or Dead space.
Resolution
When the input varies continuously over the range in the system, which may cause small change in output signals. Resolution is nothing but small change in input will cause the observable change in output also.
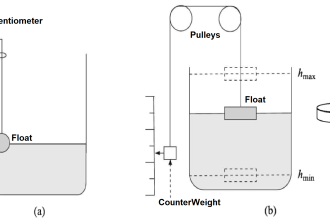
For example, in wire wound potentiometer the slider moves from one turn to the next one which will change the output resistance reasonably. For a transducer giving a digital output will produce a smallest change in output signal is 1 bit.
Output Impedance
The term output impedance comes to the action in transducers is when it gives an electrical signal output is interfaced with an electronic circuit.
Because this impedance is being connected with circuits either in series or parallel connection. The process of this action will gradually modify the behavior of the system to which it is connected.