While time is the variable used by a chromatograph to discriminate between different species (types) of chemical compounds, the concentration (quantity) of each chemical compound in the sample is inferred from the magnitude of the detector’s response as it senses each compound. Specifically, the quantity of each species present in the sample may be determined by applying the calculus technique of integration to each chromatogram peak, calculating the area underneath each curve. The vertical axis represents detector signal strength, which is proportional to the rate at which detected molecules are flowing through the sensor at any given time. This means the height of each peak represents mass flow rate of each species (W, in units of micrograms per minute, or some similar units) passing through the detector. The horizontal axis represents time, so therefore the integral (sum of infinitesimal products) of the detector signal over the time interval for any specific peak (time t1 to t2 ) represents a mass quantity that has passed through the column. In simplified terms, a mass flow rate (micrograms per minute) multiplied by a time interval (minutes) equals mass in micrograms:
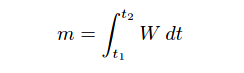
Where,
m = Mass of sample species in micrograms
W = Instantaneous mass flow rate of sample species in micrograms per minute
t = Time in minutes (t1 and t2 are the interval times between which total mass is calculated)
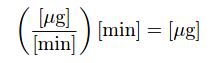
As is the case with all examples of integration, the unit of measurement for the totalized result is the product of the units within the integrand: flow rate (W) in units of micrograms per minute multiplied by increments of time (dt) in the unit of minutes, summed together over an interval, result in a mass quantity (m) expressed in the unit of micrograms. Integration is really nothing more than the sum of products, with dimensional analysis working as it does with any product of two physical quantities:
This mathematical relationship may be seen in graphical form by shading the area underneath the peak of a chromatogram:
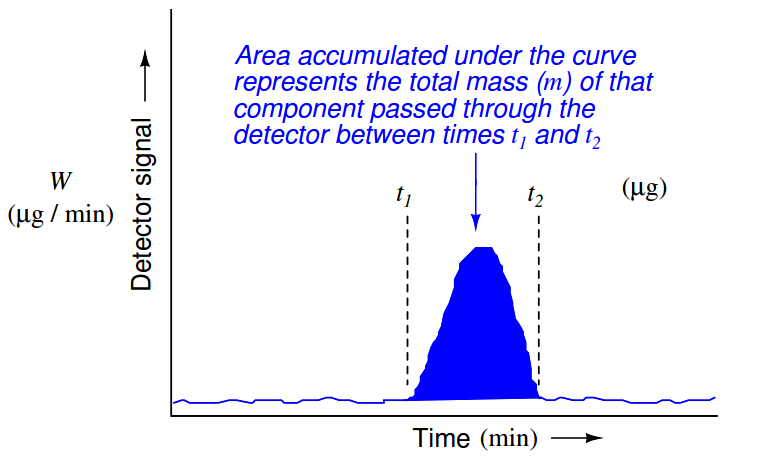
Returning to the marathon analogy again, imagine the platform scale at the finish line being the detector, the race course being the chromatograph column, and the runners being individual molecules (each type of molecule running at its own unique speed). If we wish to quantify how many runners of a certain speed were in the race, we would need to integrate the scale’s weight reading during the time period in which we expect that class of runners to arrive at the finish line. If a group of runners cross side-by-side such that they all step on the scale and leave the scale simultaneously, the scale’s indication will be a tall and narrow peak when plotted on a time-based graph. If an identical-size group of runners arrives at the finish line at some other time, but cross in single-file form rather than side-by-side, the scale will register each runner’s weight one at a time with the graphed response being a much shorter and much wider peak. In either group, though, it’s the same number of runners finishing. Therefore both the height of the peak (i.e. scale weight) and the duration of the peak need to be taken into consideration when calculating how many runners were in a particular group.
Precise quantitative measurement of species concentration, however, is a bit more complicated than simply integrating detector peaks over time. A problem we must deal with in chromatography is how a detector will respond differently to different chemical compounds. Recall that the singular qualification for a gas chromatograph detector is its ability to detect species different from than the carrier gas: so long as the detector is able to sense the passage of compounds other than carrier gas molecules, it is usable as a chromatograph detector. This non-specificity of the detector is what makes chromatography such a versatile method for chemical analysis. However, the simple requirement of being able to detect things other than carrier gas does not mean a detector will detect all non-carrier substances equally. In fact, the opposite is almost always true: each detector type responds differently to different chemical compounds, which means the accumulated area underneath a peak on a chromatogram is not a pure representation of species mass, but rather it is a product of species mass and detector sensitivity to that species.
A flame ionization detector (FID), for example, responds more strongly to a given mass flow rate of butane (C4 H10 ) than it does for the same mass flow rate of methane (CH ), due to the greater carbon-per-mass ratio of butane. This means the “raw” chromatogram will reveal a peak of greater area for butane than it will for the same mass concentration of methane, simply because the detector is naturally more sensitive to the former compound than to the latter compound.
Thermal conductivity detectors (TCD) are not immune to this problem either. TCDs exhibit varying responses to species having different specific heat and thermal conductivity coefficients. That is to say, a given mass flow rate of butane through a TCD will yield a different level of response than the same mass flow rate of methane, simply because these two compounds exhibit different thermal properties.
The inconsistent response of a chromatograph detector to different sampled species is not as troubling a problem as one might think, though. Since chromatographs operate on the principle of separating each species from the other over time, the chromatograph’s control computer is “aware” of which chemical species is passing through the detector at any given time. This fact allows us to program the computer with a set of pre-determined “response factors” describing how sensitive the detector is known to be for each species, allowing the computer to scale its interpretation of the detector’s signal during each time period when a known species exits the column. Thus, the chromatograph is able to calculate true mass concentration values based on measured peak areas and pre-programmed response factors.
For example, knowing that a flame ionization detector (FID) is more sensitive to butane than it is to methane means the response factor for butane must be programmed such that it “scales down” the calculated mass based on the detector’s raw signal during the time butane is expected to pass through it. In other words, the chromatograph’s computer “shifts gears” for each species exiting the column, during those times each expected species exits the column.
These detector response factors are determined by passing a mixture of known species proportions (a “calibration gas” sample) through the chromatograph, while programming the chromatograph computer with the known concentrations of this calibration gas. As the chromatograph separates and measures each compound, it records the detector response to each one, calculating response factors to accurately equate detector response to the known concentrations in the calibration gas (usually scaled in percent or parts-per-million). From then on, it will apply these “response factor” values to the raw detector signal, converting the detector’s signal levels into equivalent concentration units.
Most industrial process chromatographs come equipped with self-calibration ability, whereby calibration gas bottles stand connected to solenoid valves so that calibration gas may be directed to the analyzer on a pre-programmed schedule, with the chromatograph’s microprocessor controller managing these calibration cycles all on its own. This allows for frequent re-calibration of the chromatograph, to maintain its measurement accuracy over time with limited technician labor or oversight.
Also Read : Online Gas Chromatograph Principle