Using filter cells to eliminate wavelengths associated with interfering gases is called positive filtering in the field of spectroscopy. You may think of this as filtering out all the wavelengths the instrument should not “care about.” In order for positive filtering to be completely effective, the analyzer must filter out all wavelengths associated with all interfering species. In some applications, this may require multiple filters stacked in “series,” each one filtering out wavelengths for a different interfering gas. Not only is this technique cumbersome when multiple interfering “species” are present in the sample, but it is completely useless when the interfering species are unknown.
A different filtering technique called negative filtering does just the opposite: placing a filter cell in the path of the light to absorb all the wavelengths associated with the gas of interest, leaving all other wavelengths unattenuated. One application of this technique is called Gas Filter Correlation, or GFC spectroscopy. This same technique is alternatively referred to as Interference Filter Correlation, or IFC spectroscopy.
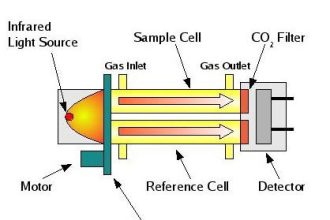
Gas filter correlation analyzers use a single gas cell rather than dual cells (sample and reference), through which a light beam of alternating spectrum is passed. A rotating filter wheel creates this alternating spectrum:
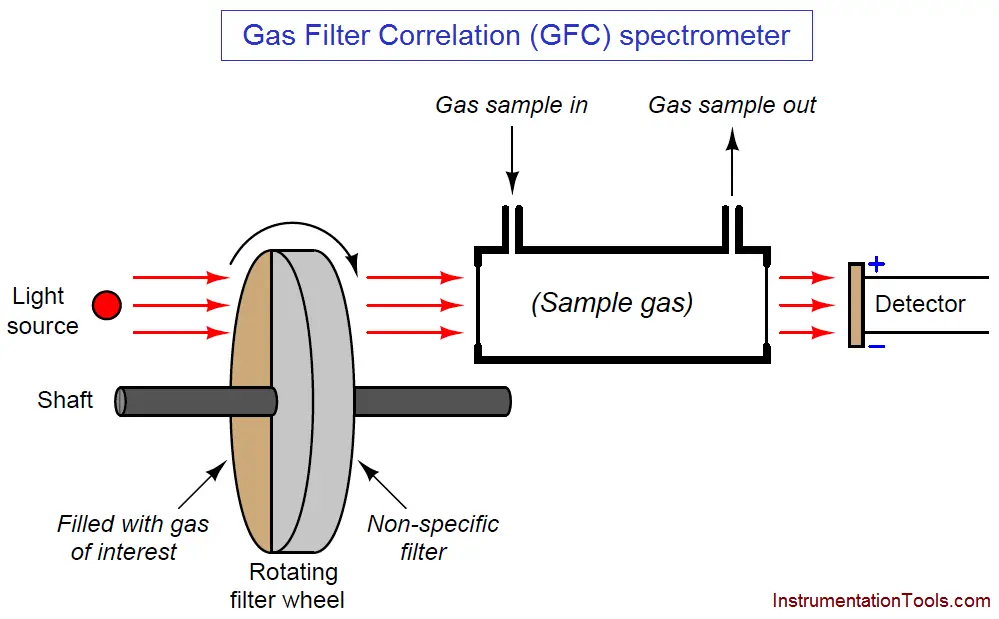
The filter wheel consists of two transparent halves: one containing a high concentration of the gas of interest, and the other designed to consistently attenuate every light wavelength (i.e. the entire spectrum) emitted by the source. The attenuation factor of the “neutral” half of this filter wheel is precisely adjusted so that the same gross intensity of infrared light enters the sample gas cell at all times, regardless of the filter wheel’s position. The light detector positioned after the sample cell must be designed for non-specific response to light (i.e. not selective to certain wavelengths of light). Unlike a Luft detector, we want this detector to respond to a broad spectrum of light.
If the sample gas chamber contains nothing but non-absorbing gases, the detector will generate a steady (unchanging) signal (Note 1) because it receives the same total light intensity during each half of the filter wheel’s rotation, albeit at different wavelengths during each half of the wheel’s rotation.
Note 1 : Real GFC analyzers also have a chopper wheel preceding the filter wheel to create a pulsating light beam. This causes the detector signal to pulsate as well, allowing the analyzer to electronically filter out sensor “drift” just as in the dual-beam NDIR analyzer design. The chopper wheel has been eliminated from this diagram (and from the discussion) for simplicity. If it were not for the chopper wheel, the GFC analyzer would be prone to measurement errors caused by detector drift.
If some of our gas of interest enters the sample cell, it will begin to absorb some of the light during the time when the “neutral” filter aligns in front of the cell. During the other half of the filter’s rotation (when the light must pass through the high gas concentration chamber), our gas of interest inside the sample cell has no effect, because all those wavelengths of light have been eliminated by the filter. The result is a changing signal at the detector ( Note 2 ), the amplitude of oscillation proportional to the concentration of “correlating” gas (matching the absorption spectrum of the rotating filter’s gas) inside the sample cell.
Note 2 : As said above, real GFC analyzers have a chopper wheel preceding the filter wheel to make the light beam pulse in addition to changing its spectral composition. This chopper wheel generates multiple light pulses per rotation of the filter wheel. Thus, the signal output by the detector is actually an amplitude-modulated waveform, with the “carrier” frequency being the chopper wheel’s pulsing and the slower “modulating” frequency being the filter wheel’s rotation cycle. Hopefully by now you see why I decided to omit the chopper wheel “for simplicity.”
The effect of “interfering” gases in the sample cell depends on the nature of those gases. An “interfering” gas with an absorption spectrum encompassed by the absorption spectrum of the gas of interest would be indistinguishable from the gas of interest by this instrument – we would say this gas has a positive interference. Such a gas would absorb wavelengths of light from the beam during the time light passes through the “neutral” filter, and it would absorb no wavelengths during the time light passes through the gas filter, just like the gas of interest. A different “interfering” gas absorbing completely different wavelengths of light than our gas of interest would absorb light at all times regardless of the filter wheel’s position. However, given an equal percentage of absorption in a region of the spectrum untouched by the gas filter side of the wheel, but uniformly attenuated by the “neutral” side of the wheel, means that the effect of this gas would be to absorb more light during the gas-filtered part of the wheel’s rotation and less light through the “neutral-filtered” part of the wheel’s rotation – just the opposite of positive interference. Thus, a gas with an absorption spectrum wholly different from our gas of interest will have a negative interference effect.
In order to avoid interference of any kind from gases other than the one we are interested in measuring, the effects of positive and negative correlation interference must cancel. Fortunately for this technique, most interfering gases partially overlap spectra with most gases of interest. If the degree of overlap is approximately even, the positive and negative interferences will indeed cancel each other, resulting in little or no interference from the “interfering” gas.
To re-phrase this principle: if the absorption spectrum of a gas perfectly correlates with the spectrum for our gas of interest, the effect will be “positive,” making the analyzer think there is a greater concentration of the gas of interest than there actually is. If the absorption spectrum of a gas is perfectly anti-correlated with the spectrum of our gas of interest, the effect will be “negative,” making the analyzer think there is a weaker concentration of our gas of interest than there actually is. However, if the absorption spectrum of any gas is completely uncorrelated (i.e. random overlap of spectra) with the spectrum for our gas of interest, there interference will be neutral (little or no effect).
This makes the Gas Filter Correlation (GFC) analyzer ideally suited to distinguish gases whose spectra overlap over the same general ranges but differ in fine detail (i.e. where the individual “peaks” and “dips” in the different spectra randomly intersect). One such practical application for GFC analyzers is combustion exhaust gas analysis for carbon monoxide (CO) in the presence of carbon dioxide (CO2) and water vapor. Unlike the dual-beam “Luft detector” style of analyzer, the GFC analyzer does not require individual filter cells for each interfering species of gas. This is a major advantage where multiple interfering gases coexist with the gas of interest.
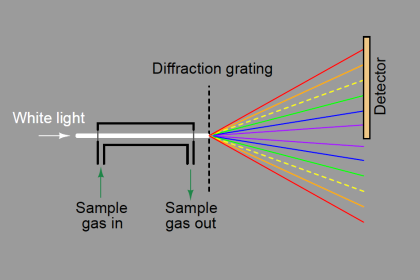
Being a single-beam style of analyzer, GFC instruments are much easier to implement as open-air gas analyzers than dual-beam designs. Dual-beam analyzers require sample and reference cells of equal length and identical construction, in order to draw a comparison between the light passing through sample versus the same light passing through a completely non-absorbing gas. Single-beam analyzers have no need for a reference light path, and so the sample beam may be passed through open air (or through the diameter of an exhaust stack, for example) to sense gases anywhere in that region, rather than be limited to the physical length of any gas-filled cell. Recall from the Beer-Lambert law that absorbance increases in direct proportion to the path length of the light:
Where,
A = Absorbance
a = Extinction coefficient for photon-absorbing substance(s)
b = Path length of light traveling through the sample
c = Concentration of photon-absorbing substance in the sample
I0 = Intensity of source (incident) light
I = Intensity of received light after passing through the sample
The longer the path length, the more light will be absorbed by the gas, all other factors being equal. This increases the analyzer’s sensitivity to low concentrations, which is especially important when measuring gas concentrations in the low parts-per-million (ppm) or even parts-per-billion (ppb) range.
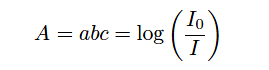
An example diagram for a GFC analyzer used to measure gas concentrations in open air is shown here:
Light passing through the rotating filter wheel strikes a beam splitter (a partially-silvered glass plate angled at 45o) where approximately half the light passes through to the sample space and the other half is lost to reflection. At the far end of the sample space, a full-silvered mirror reflects all the light back to the analyzer, where it strikes the beam splitter again, with approximately half of that light reflecting off at 90o to reach the detector. With this arrangement, the path length (b in the Beer-Lambert Law) is equal to twice the distance between the analyzer and the mirror, since light must travel one way to reach the mirror, then return the same distance back to the analyzer. As you might imagine, extremely long path lengths are easy to achieve with this style of open-air analyzer.


Instruments Method By Chemical Analysis In Petrochemical Oil& Gas /Refinery, What Is the Practical Procedure & Its Application In Petrochemical & Oil Gas /Refinery