Every technical discipline has its own standardized way(s) of making descriptive diagrams, and instrumentation is no exception.
Instrumentation Documents

The scope of instrumentation is so broad, however, that no one form of diagram is sufficient to capture all we might need to represent
. This article will discuss three different types of instrumentation diagrams:
- Process Flow Diagrams (PFDs)
- Piping and Instrumentation diagrams (P&IDs)
- Loop diagrams
- Functional diagrams
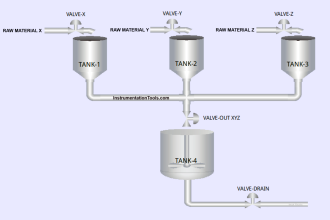
Process Flow Diagram
At the highest level, the instrument engineer/technician is interested in the interconnections of process vessels, pipes, and flow paths of process fluids.
The proper form of the diagram to represent the “big picture” of a process is called a process flow diagram. Individual instruments are sparsely represented in a PFD, because the focus of the diagram is the process itself.
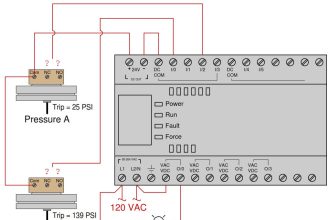
Loop Diagram
At the lowest level, the instrument engineer/technician is interested in the interconnections of individual instruments, including all the wire numbers, terminal numbers, cable types, instrument calibration ranges, etc. The proper form of diagram for this level of fine detail is called a loop diagram.
Here, the process vessels and piping are sparsely represented, because the focus of the diagram is the instruments themselves.
Piping and instrumentation diagrams
Piping and instrumentation diagrams (P&IDs) lie somewhere in the middle between process flow diagrams and loop diagrams.
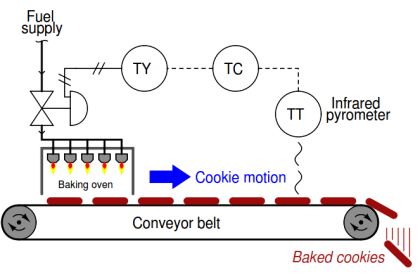
A P&ID shows the layout of all relevant process vessels, pipes, and machinery, but with instruments superimposed on the diagram showing what gets measured and what gets controlled.
Here, one can view the flow of the process as well as the “flow” of information between instruments measuring and controlling the process.
Functional Diagrams
Functional diagrams are used for an entirely different purpose: to document the strategy of a control system.
In a functional diagram, emphasis is placed on the algorithms used to control a process, as opposed to piping, wiring, or instrument connections. These diagrams are commonly found within the power generation industry but are sometimes used in other industries as well.
Instrument Engineer Documents
An instrument engineer/technician must often switch between different diagrams when troubleshooting a complex control system. There is simply too much detail for any one diagram to show everything.
Even if the page were large enough, a “show everything” diagram would be so turgid with details that it would be difficult to focus on any particular grouping of details you happened to be interested in.
The narrowing of scope with the progression from PFD to loop diagram may be visualized as a process of “zooming in,” as though one were viewing a process through the lens of a microscope at different powers.
First you begin with a PFD or P&ID to get an overview of the process, to see how the major components interact.
Then, once you have identified which instrument “loop” you need to investigate, you go to the appropriate loop diagram to see the interconnection details of that instrument system so you know where to connect your test equipment and what signals you expect to find when you do.
Example
Another analogy for this progression of documents is a map, or more precisely, a globe, an atlas, and a city street map. The globe gives you the “big picture” of the Earth, countries, and major cities.
An atlas allows you to “zoom in” to see details of particular provinces, states, and principalities, and the routes of travel connecting them all.
A city map shows you major and minor roads, canals, alleyways, and perhaps even some addresses in order for you to find your way to a particular destination. It would be impractical to have a globe large enough to show you all the details of every city!
Furthermore, a globe comprehensive enough to show you all these details would have to be updated very frequently to keep up with all cities’ road changes. There is a certain economy inherent to the omission of fine details, both in ease of use and in ease of maintenance.
Also Read: Instrumentation Project Documents


Hello dear
I think P&ID stands for PIPING and instruments diagram, pardon me.
Thanks for your great work it’s really good to me.
Updated, Thanks
thank you for sharing valuable details
this is a very good document
thank you
Thank you . This information is really helpful ??