Cavitation is an applied science that has not evolved to the highly refined level that supporting the more traditional control valve sizing calculations.
However, there is a great need by users and manufacturers alike for practical information in this area.
Cavitation Definition
The definition of cavitation is given as a two-stage process associated with the flow of liquids.
The first stage involves the formation of vapour cavities or bubbles in the flow stream as a result of the local static pressure in the flow stream dropping below the liquid vapour pressure.
The second stage of the process is the subsequent collapse or implosion of the vapour cavities back to the liquid state when the local static pressure again becomes greater than the fluid vapour pressure.
Cavitation is a phenomenon that can accompany the flow of liquids through control valves. Failure to account for cavitation can result in potentially costly performance problems.
To prevent this situation, it is important that personnel responsible for control valve specifications understand the nature of cavitation and fundamental abatement technology.
Familiarity with this material is encouraged. Successful solutions to cavitation problems still rely heavily on engineering judgments stemming from insight into cavitation basics.
Simply viewed, cavitation consists of the formation, growth, and rapid collapse of cavities in a liquid. These vapour cavities (bubbles) are formed whenever the prevailing fluid pressure falls below the vapor pressure of the liquid. They subsequently collapse if the pressure again rises above the vapor pressure.
Causes of Cavitation
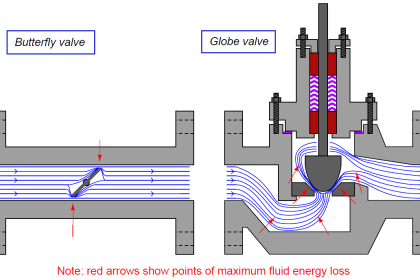
Different specific sources of pressure changes cause cavitation, but they all arise from the flow of the liquid through the control valve. Cavitation usually begins in the low-pressure regions associated with boundary layer separation.
This may occur even though the mean pressure is greater than the vapor pressure. Mean pressure (the average static pressure in the plane perpendicular to the flow path) will decrease as the liquid passes through the various restrictions in the valve trim. The degree and extent of cavitation escalate when the mean pressure falls below the vapor pressure in these regions.
Unacceptable noise levels, excessive vibrations, and physical damage to the valve and adjacent hardware are the foremost problems associated with cavitation. These problems all arise from the collapse of the vapor cavities. Material damage results from shock waves and micro-jets, established during cavity collapse, impinging on the boundary surfaces.
Corrosion further aggravates these mechanical attack mechanisms. The physical appearance of cavitation damage varies from a “frosted glass” appearance to a rough, cinder-like surface texture.
Another “side effect” of cavitation is an apparent decrease in the efficiency of the valve. The compressibility introduced to the fluid when a portion of the liquid vaporizes can ultimately lead to a choked flow condition similar to a flashing fluid.
While treated simply in this section, cavitation is a very complex sequence of events. Not all cavitation necessarily results in the problems mentioned above. However, attempts to model the behaviour of the cavitating liquid have not met with universal success. Distinguishing “problem causing” cavitation from acceptable behaviour presents some very real challenges.
Historically, the control valve industry has adopted the practice of describing cavitation applications in terms of a single, unadjusted parameter. In this approach, the suitability of a given control valve is determined by comparing the value of this parameter evaluated at operating conditions to an “operating limit” for that control valve.
While appealing from a user standpoint, the approach described above suffers from some major drawbacks. First, the definition of the parameter and the manner in which it is used have varied significantly from manufacturer to manufacturer. While the principle underlying the method is basically the same, the differences in appearance lead to much confusion.
Furthermore, the complexity of cavitation renders it difficult to predict the exact behaviour in any given service on the basis of a single, unadjusted parameter. Many service factors can affect the apparent level of cavitation. Unfortunately, no currently known model fully describes the intensity or extent of cavitation under universally varying conditions regardless of the number of parameters employed.
The operating limit used as the basis for comparison has, in many instances, being equal to the value of the pressure recovery factor, FL. If a valve is operated at the limit defined by the pressure recovery factor, the valve is at or near choked flow conditions. Substantial vapor has been formed in the flow stream, and significant levels of cavitation can exist.
As discussed elsewhere, using FL in this manner is not a universally correct solution and is, in general, valid only for specially designed valve trims. The vast majority of valves cannot operate problem-free under this condition.
Levels of Cavitation
The different levels of cavitation are as follows:
- Incipient cavitation
- Constant cavitation
- Incipient damage
- Choking cavitation; and
- Maximum vibration cavitation.
These various levels are a strong function of the internal geometry of the control valve. It can be expected that different values of any given cavitation coefficient will be associated with different valve styles or even different openings of the same valve.
Read Next:
- Control Valves Course
- Valve Quiz Questions
- Control Valve Accessories
- Control Valve Stroke Test
- Valve Characteristics