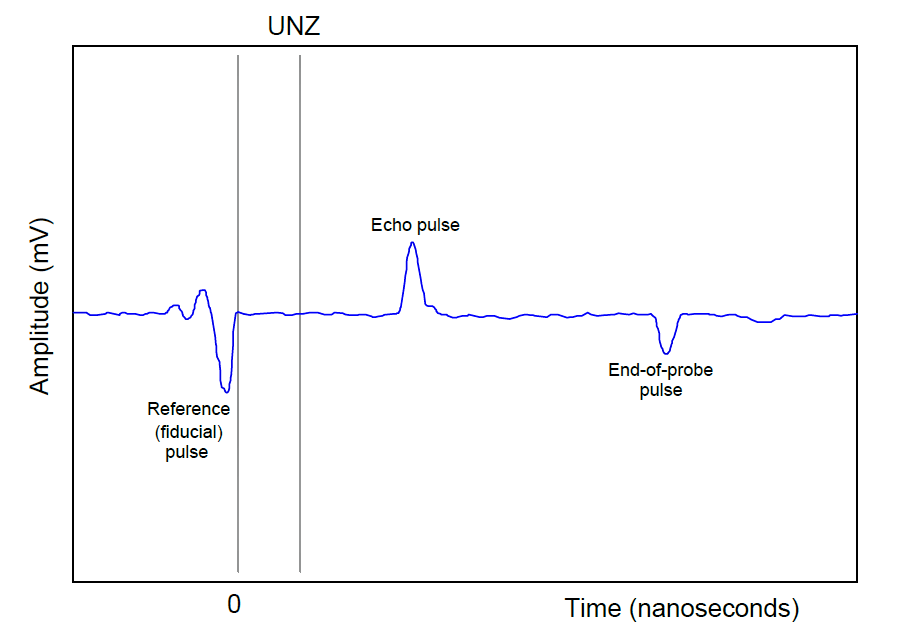
The following graph shows the signal strength received by a guided-wave radar (GWR) level instrument over time:
Explain how the graph will change if:
1. The liquid level increases
2. The dielectric constant (ε) of the liquid decreases
3. The density of the liquid decreases (assuming constant ε)
4. A liquid-liquid interface consisting of two liquids with different densities is introduced into the vessel
5. Also, explain what UNZ refers to (the Upper Null Zone).
6. Describe a practical reason for configuring a radar transmitter to have an upper null zone, and how this differs from a radar instrument’s transition zones.
7. Explain why the timing of both the echo pulse and the end-of-probe pulse will shift as liquid level changes in this system.
Share your answers and explanation with us through the below comments section.
Read Next:
Credits: Tony R. Kuphaldt
VFD simulator download: Master the online tool from the Yaskawa V1000 & programming software for…
The conveyor sorting machine is widely used in the packing industries using the PLC program…
Learn the example of flip-flop PLC program for lamps application using the ladder logic to…
In this article, you will learn the STAR DELTA programming using PLC controller to start…
Lube oil consoles of rotary equipment packages in industrial process plants are usually equipped with…
Rotating equipment packages such as pumps, compressors, turbines need the lube oil consoles for their…
