Industrial automation systems have a wide range of documents for working with better engineering. Each has its own purpose of use, so that the engineers can differentiate between them and work accordingly. One such document is the operation sequence chart or OSC. Programmers specifically need to understand this document for precise programming and minimum bugs. Its main purpose is used when the logic has a complex range of operating sequences.
Why is OSC important in industrial automation?
Suppose I have a process where there are 3 motors and 6 valves. The process has around 10 steps of operation, which need to be executed in sequence and interlock with each other as well as the alarms. This will then be used by the programmer to exactly convert that into his logic. Also, it needs to be implemented in such a way that the process, mechanical, and automation teams avoid any miscommunication in design.
For this purpose, if you consider a control philosophy, then it is just a basic automation overview of the plant. And if you consider the control logic chart, it cannot have such a vast sequence of operations with a proper matrix, though it can provide smaller and less complex sequences. For this purpose, an OSC is used.
An operation sequence chart is a document that contains the flow of logic sequence in steps, and mentions which outputs will be on during that time. It also mentions the transition phase from one step to another, what conditions must be met before a step executes, what triggers the next step, and also represents a normal or faulty state. This is the main reason why an OSC is of utmost importance in industrial automation applications, where the regular documents cannot cover all these to such an extent. We will understand this more by the given example.
How to write an operation sequence chart?
Refer to the image below for an example. Here, you can see that we have defined the names of equipment, mode name, description of the mode, and comments as the header. Basically, we intend to write each step, what outputs will be on or off during that step, how the transition will occur between each step, and the various states inside a particular step (like ready and fault here). Due to this, a programmer knows when the step needs to be executed simply, but in a very wide and broad way.
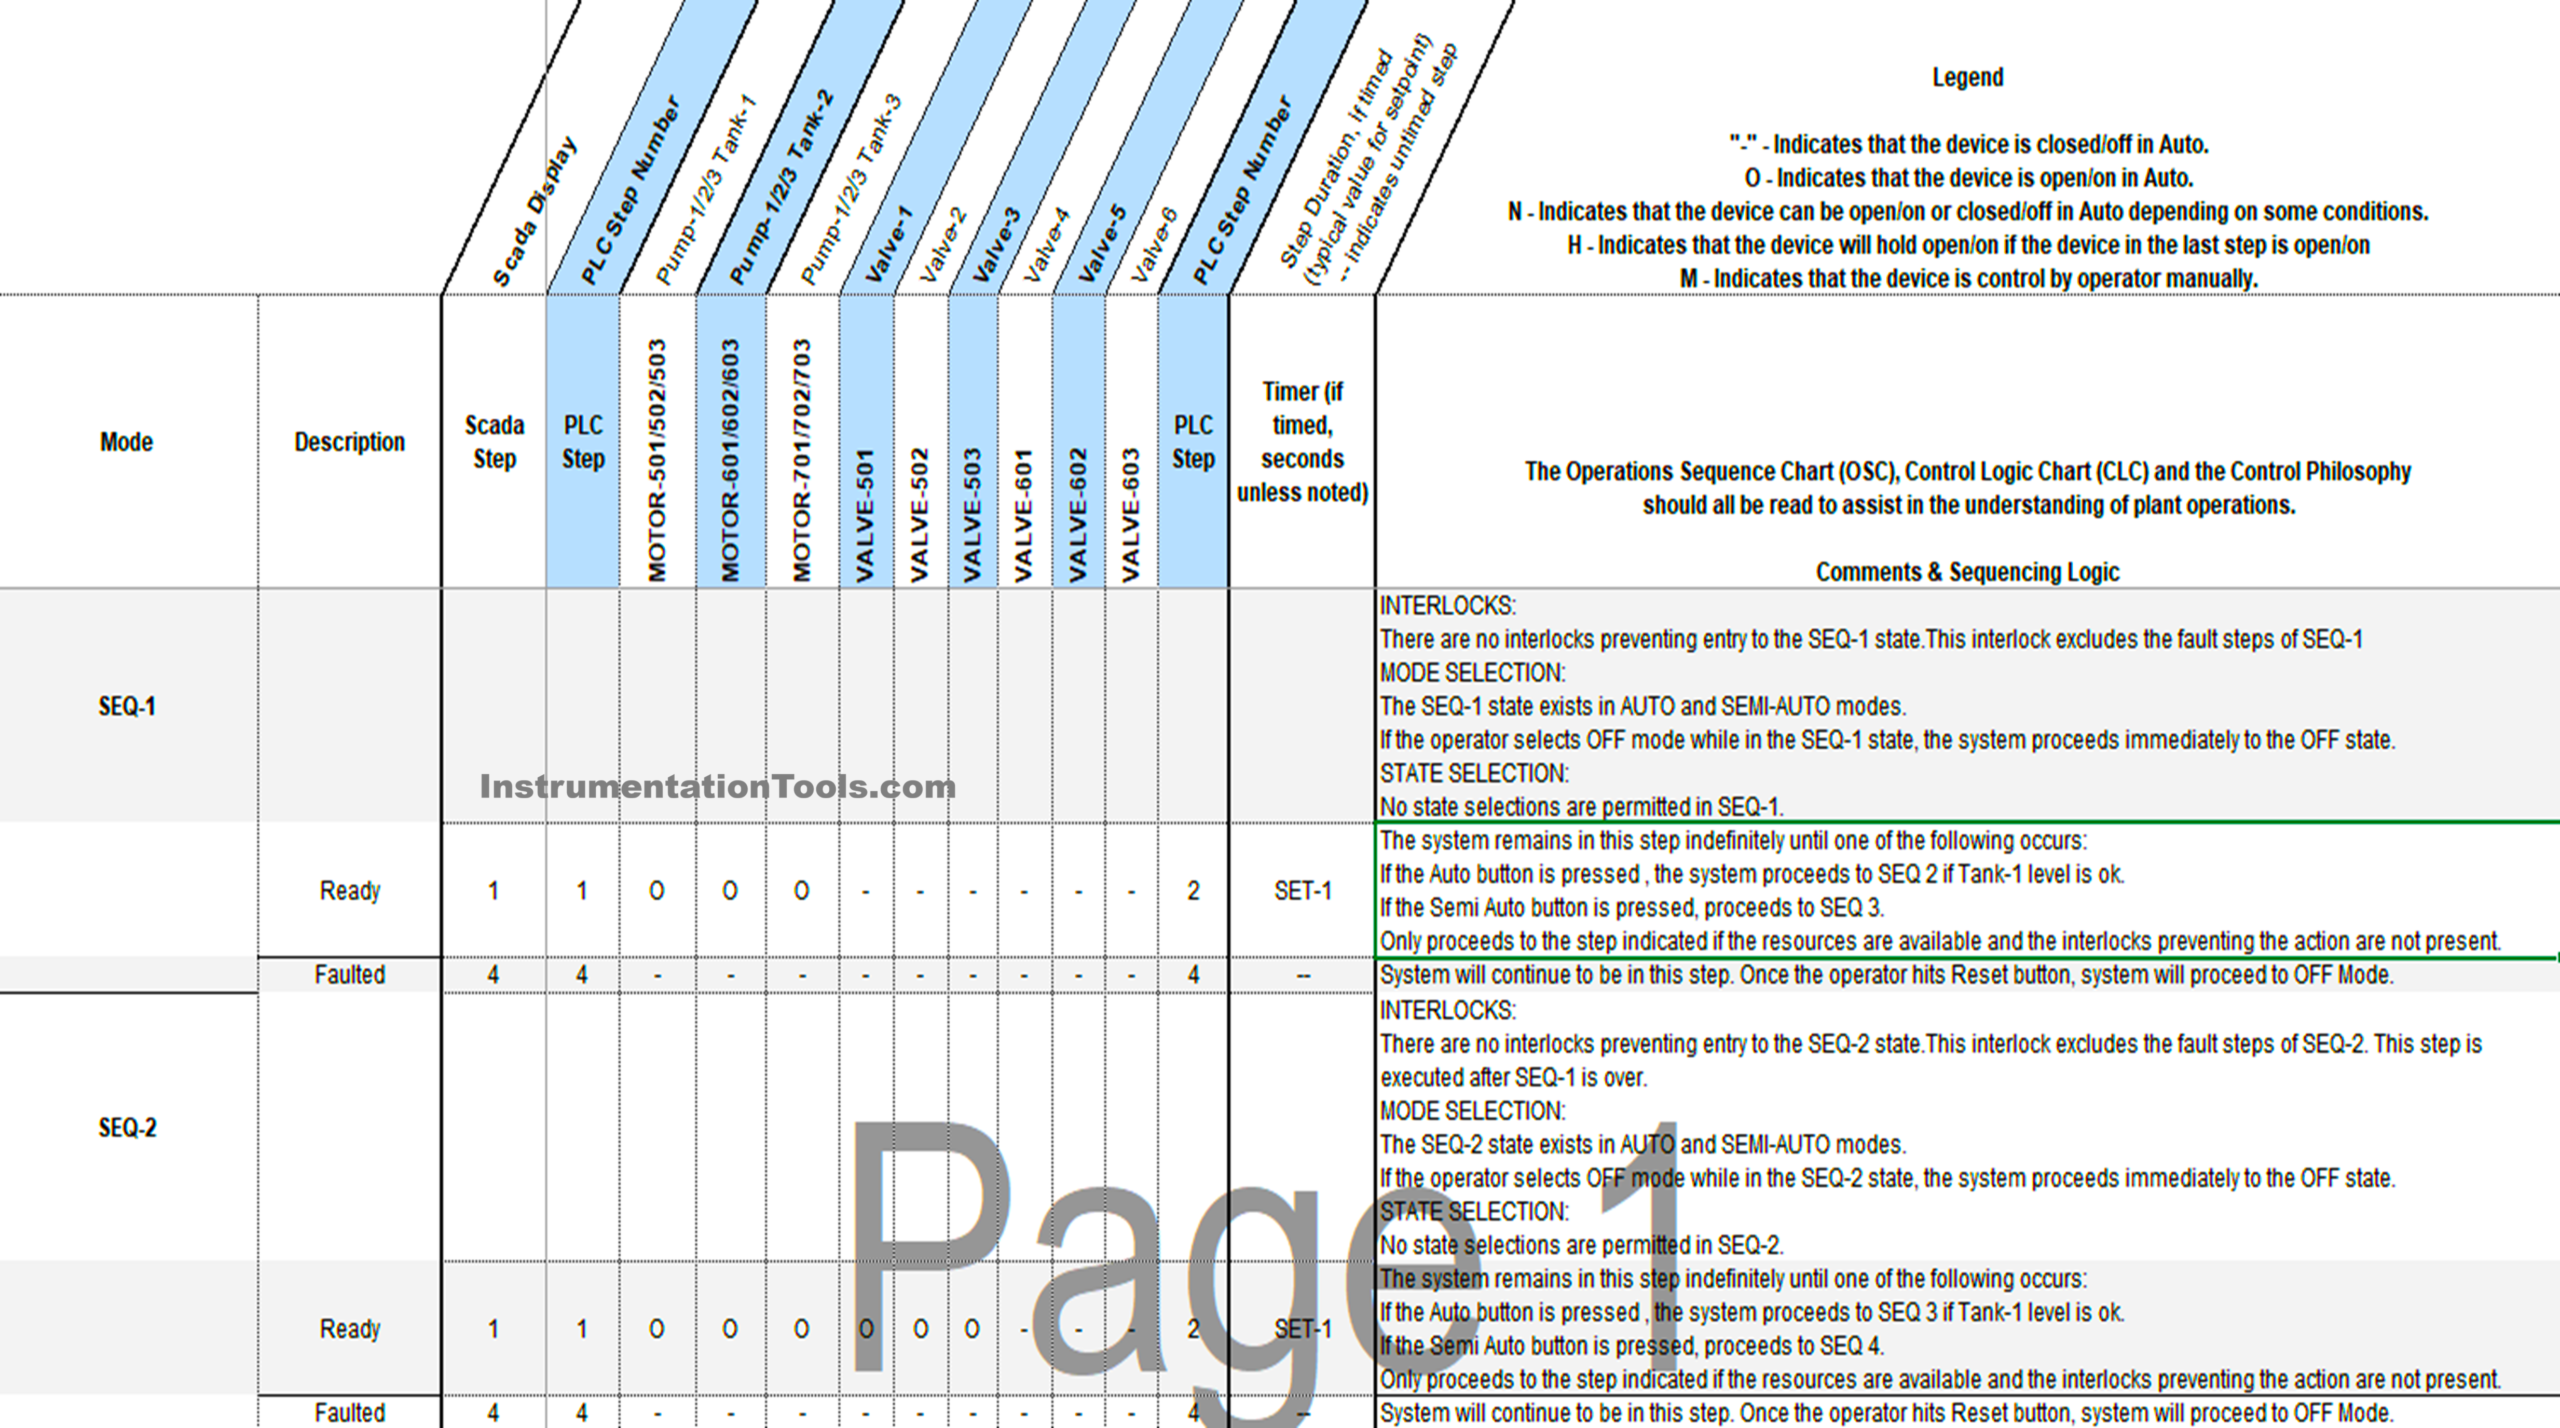
In the image, as you can see, we have defined two steps – Seq 1 and Seq 2. In them, we have two states – ready and fault. That means we need to define what action happens in each of the states. Then, we have a matrix of outputs, of 3 pumps and 6 valves. This is done to depict which output will remain on or off during a particular state of a sequence. Then, we have set values which will be entered from SCADA, for that particular sequence and step. Finally, we have comments that describe the working of each state, how it will jump to other states, and what interlocks are present for that state to run.
As you can see, the core idea was to explain to the programmer how the steps will be executed. A typical OSC will thus contain – what to do if something goes wrong, what moves the step to the next one, safety and process checks, what outputs are controlled in each step, what inputs are required for a particular step, an ordered list of all steps, what must be true before starting any step, and what modes of operation are present. An operation sequence chart is thus required if the sequence is vast and complex to understand with single-line statements. Such a matrix-type format makes it easy for a programmer to understand the whole system.
It is fine if you use CLC or a control logic chart to write sequences, but only when there are few steps, the logic is linear and not jumping, there are few devices, few interlocks, and when the customer prefers only a few documents. Otherwise, it is necessary to write OSC.