As we know, forward bias produces current through a diode and reverse bias essentially prevents current, except for a negligible reverse current. Reverse bias prevents current as long as the reverse-bias voltage does not equal or exceed the breakdown voltage of the junction. In this section, we will examine the relationship between the voltage and the current in the diode.
V-I Characteristic for Forward Bias
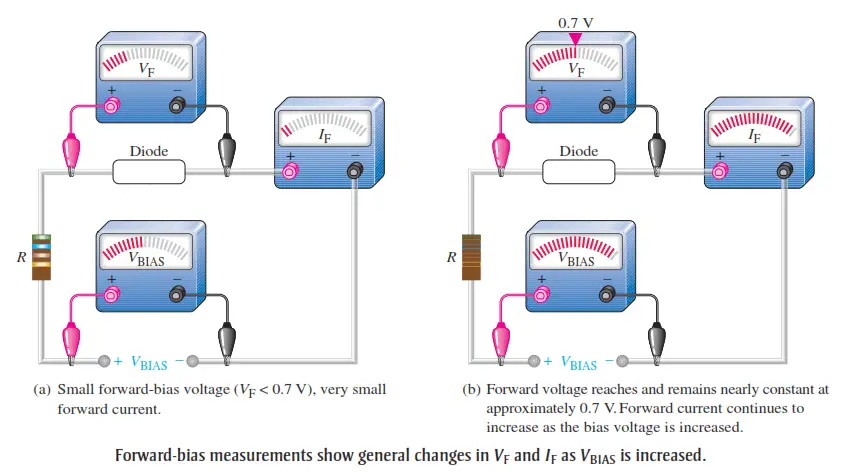
When a forward-bias voltage is applied across a diode, there is current. This current is called the forward current and is designated IF. Figure illustrates what happens as the forward-bias voltage is increased positively from 0 V. The resistor is used to limit the forward current to a value that will not overheat the diode and cause damage. With 0 V across the diode, there is no forward current. As you gradually increase the forward-bias voltage, the forward current and the voltage across the diode gradually increase, as shown in Figure (a).
A portion of the forward-bias voltage is dropped across the limiting resistor. When the forward-bias voltage is increased to a value where the voltage across the diode reaches approximately 0.7 V (barrier potential), the forward current begins to increase rapidly, as illustrated in Figure (b). As you continue to increase the forward-bias voltage, the current continues to increase very rapidly, but the voltage across the diode increases only gradually above 0.7 V. This small increase in the diode voltage above the barrier potential is due to the voltage drop across the internal dynamic resistance of the semiconductive material.
Graphing the V-I Curve If you plot the results of the type of measurements shown in Figure on a graph, you get the V-I characteristic curve for a forward-biased diode, as shown in Figure (a). The diode forward voltage (V horizontal axis, and the forward current (IFF) increases to the right along the ) increases upward along the vertical axis.
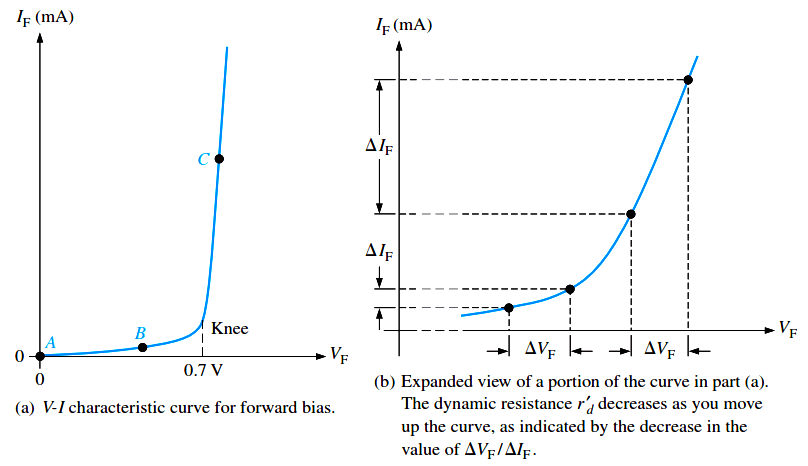
Fig : Relationship of voltage and current in a forward-biased diode
As you can see in Figure (a), the forward current increases very little until the forward voltage across the pn junction reaches approximately 0.7 V at the knee of the curve.After this point, the forward voltage remains nearly constant at approximately 0.7 V, but IF increases rapidly. As previously mentioned, there is a slight increase in VF above 0.7 V as the current increases due mainly to the voltage drop across the dynamic resistance. The IF scale is typically in mA, as indicated.
Three points A, B, and C are shown on the curve in Figure (a). Point A corresponds to a zero-bias condition. Point B corresponds to Figure (a) where the forward voltage is less than the barrier potential of 0.7 V. Point C corresponds to Figure (a) where the forward voltage approximately equals the barrier potential. As the external bias voltage and forward current continue to increase above the knee, the forward voltage will increase slightly above 0.7 V. In reality, the forward voltage can be as much as approximately 1 V, depending on the forward current.
V-I Characteristic for Reverse Bias
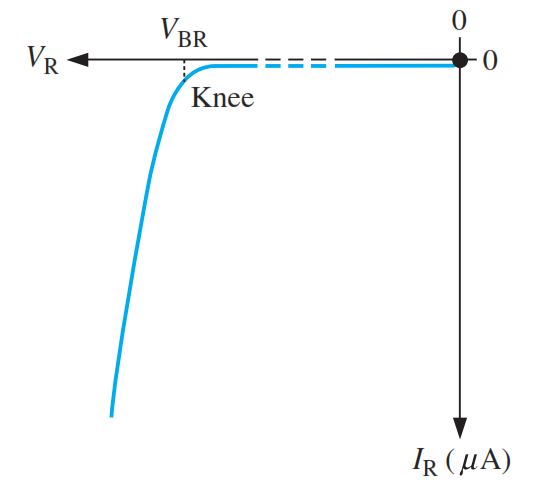
When a reverse-bias voltage is applied across a diode, there is only an extremely small reverse current (IR) through the pn junction. With 0 V across the diode, there is no reverse current. As you gradually increase the reverse-bias voltage, there is a very small reverse current and the voltage across the diode increases. When the applied bias voltage is increased to a value where the reverse voltage across the diode (VR) reaches the breakdown value (VBR), the reverse current begins to increase rapidly.
As you continue to increase the bias voltage, the current continues to increase very rapidly, but the voltage across the diode increases very little above VBR. Breakdown, with exceptions, is not a normal mode of operation for most pn junction devices.
Graphing the V-I Curve
If you plot the results of reverse-bias measurements on a graph, you get the V-I characteristic curve for a reverse biased diode. A typical curve is shown in Above Figure. The diode reverse voltage (VR) increases to the left along the horizontal axis, and the reverse current (IR) increases downward along the vertical axis. There is very little reverse current (usually mA or nA) until the reverse voltage across the diode reaches approximately the breakdown value (VBR) at the knee of the curve.
After this point, the reverse voltage remains at approximately VBR, but IR increases very rapidly, resulting in overheating and possible damage if current is not limited to a safe level. The breakdown voltage for a diode depends on the doping level, which the manufacturer sets, depending on the type of diode. A typical rectifier diode (the most widely used type) has a breakdown voltage of greater than 50 V. Some specialized diodes have a breakdown voltage that is only 5 V.
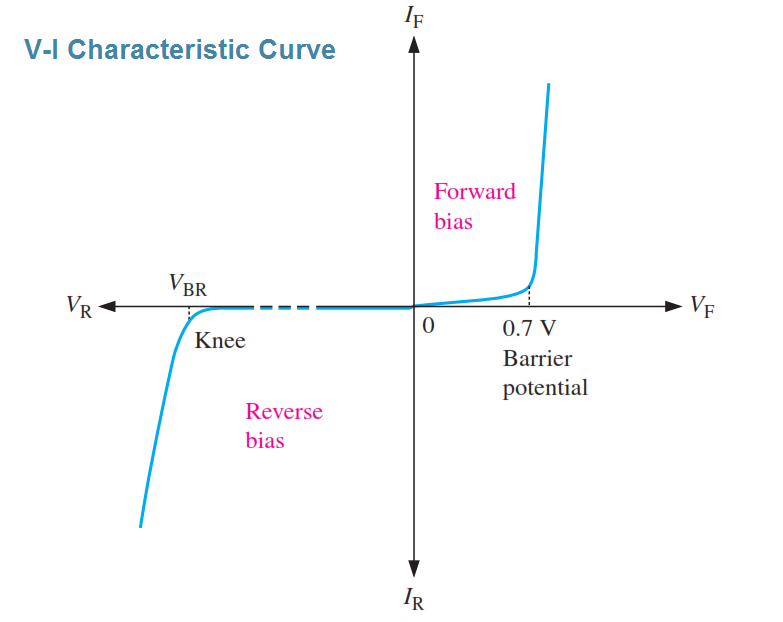
The Complete V-I Characteristic Curve
Combine the curves for both forward bias and reverse bias, and you have the complete V-I characteristic curve for a diode, as shown in Below Figure.
Temperature Effects
For a forward-biased diode, as temperature is increased, the forward current increases for a given value of forward voltage. Also, for a given value of forward current, the forward voltage decreases. This is shown with the V-I characteristic curves in Below Figure. The blue curve is at room temperature (25°C) and the red curve is at an elevated temperature (25°C + ΔT). The barrier potential decreases by 2 mV for each degree increase in temperature.
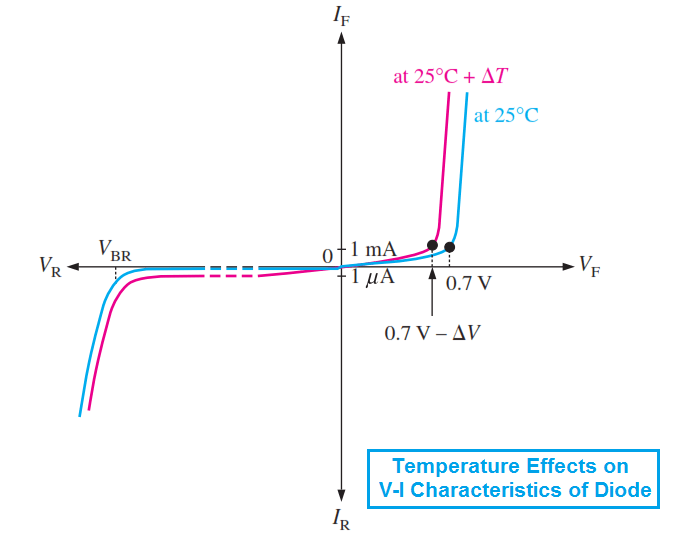
Fig : Temperature effect on the diode V-I characteristic. The 1 mA and 1 mA marks on the vertical axis are given as a basis for a relative comparison of the current scales.
For a reverse-biased diode, as temperature is increased, the reverse current increases. The difference in the two curves is exaggerated on the graph illustration. Keep in mind that the reverse current below breakdown remains extremely small and can usually be neglected.