Device diagnostics can be carried out using a handheld communicator in the field, a laptop in the workshop, or from intelligent device management software as part of asset management system, either from a dedicated maintenance console or integrated in the operator console.
Electronic Device Description Language (EDDL) is the technology used by device manufacturers to control how the device diagnostics is displayed to the technician. EDDL makes diagnostics of smart transmitters and other intelligent devices easier thanks to user guidance such as wizards and help, and provides unparalleled consistency of use.
With the “device level access” and these wizards the user interface for fieldbus devices and for 4-20 mA/HART devices have become equally easy to use and look almost identical, but the device diagnostics is not the same.
Viewing and monitoring of internal variables can also be helpful for troubleshooting. See separate white paper on internal variables.
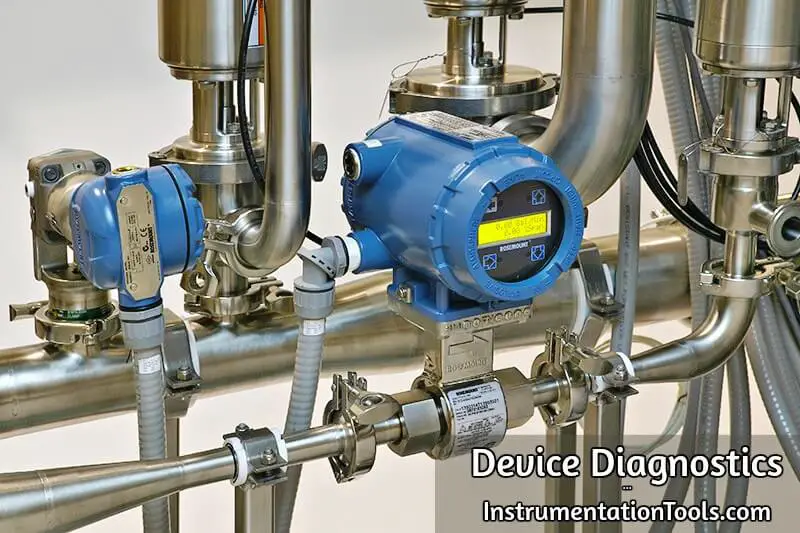
Device Diagnostics
Device diagnostics is performed by the device itself, that is, self-diagnostics or self-tests. 4-20 mA/HART, FOUNDATION fieldbus, PROFIBUS, or WirelessHART protocols are used to communicate the result of the self-diagnostics to the handheld communicator or intelligent device management software.
Each protocol has a different mechanism for reporting diagnostics and therefore performs differently. That is, the computer software or handheld is used for display.
In a vast majority of cases diagnostics is embedded in the device itself as firmware so that the device is monitored continuously. In some rare cases when the device is unable to perform the test, the test must be conducted from computer software, with the drawback it is not continuous, it is active only when the computer software is running.
Different communication technology is associated with different power availability for the device, and thus different levels of sophistication are possible for the diagnostics.
FOUNDATION fieldbus
Information in FOUNDATION fieldbus devices is organized in different kinds of blocks:
- Resource block
- Transducer blocks
- Function blocks
The function blocks are referred to as the “Control Application” and the resource block and transducer blocks are referred to as the “Device Application”.
Each device has one resource block and one or more transducer and function blocks. Function blocks are the control strategy. There is one transducer block associated with each sensor or transducer.
Each block has some device diagnostics (and some setup parameters). However, in the past, the compartmentalization of information by blocks made troubleshooting of fieldbus devices cumbersome as diagnostics in different blocks did not appear on the same page in the device management software (the technician had to know which block to look at for each potential problem to be checked).
However, now “device level access” (aka “cross-block”) makes FOUNDATION fieldbus devices easier to use by displaying all diagnostics on one page. Technicians will not have to worry about different kinds of blocks.
Function blocks
Troubleshooting of the function blocks (the control strategy problems) is normally done from the DCS engineering station, by system engineers, not instrument technicians.
Transducer and Resource blocks
Transducer blocks and the resource blocks are for troubleshooting of the device itself, normally handled from the intelligent device management software.
A device may have several transducer blocks including for example: sensor transducer block, actuator transducer block, display transducer block, and other transducer blocks for special features such as advanced diagnostics, flow computer etc
PROFIBUS
PROFIBUS groups diagnostics in blocks (slots) somewhat similar to FOUNDATION fieldbus. This will not be explained again. In PROFIBUS the resource block is instead called physical block.
Device Integration
Plants have a mix of simple and sophisticated (complex) devices from different manufacturers using different communication protocols. The diagnostics available depends on the type of device:
- Pressure transmitter: sensor failure, plugged impulse line, sensor temperature limits exceeded
- Temperature transmitter: sensor failure, thermocouple degradation
- Control valve positioner: travel histogram, step-response, valve signature, pressure sensor failure, abnormal drive current, travel deviation, reversal count alert, accumulated travel alert, low supply pressure, high supply pressure, position feedback sensor failure, etc.
- Shutdown valve monitor: Partial Stroke Testing (PST)
- Coriolis flowmeter: flow tube stiffness, drive gain
- Magnetic flowmeter: magnetic field strength, coil resistance, electrode resistance, grounding, noise, and empty pipe
- Ultrasonic flowmeter: flow profile, turbulence, Speed of Sound
- Vortex flowmeter: pickup failure
- pH analyzer: glass electrode impedance, reference electrode impedance
- Gas chromatograph: power failure, user calculation failure, warm start failed, heater out of range, flameout, flame over-temperature, no sample flow, low carrier pressure, and stream validation failure
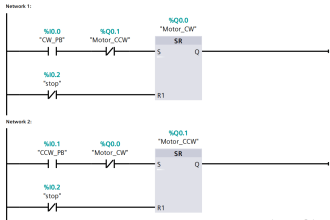
- Electric actuator / Motor Operated Valve (MOV): over torque, actuator fail, lost control voltage, lost phase, motor overload, and valve stall
- Uninterruptible Power Supply (UPS): fuse blown
- Variable Speed Drive (VSD) / Variable Frequency Drive (VFD): motor decelerating too quickly, overload, overheating, and mains loss
- Bus diagnostics: supply voltage, noise level, signal level, and retransmission statistics
The diagnostics available vary greatly from one manufacturer to the others.
Examples
Temperature Transmitter Diagnostics
A temperature transmitter is a relatively simple device, but high-end models have some interesting diagnostics. When a sensor fails, the diagnostics display pin-points which sensor it is and what the problem is. Device manufacturer experts often include conditional images to clearly illustrate the problem.
Details of the problem are revealed at the click of a button permitting the technician to determine that the problem is not with the transmitter but with the sensor. Because problem areas are highlighted, lots of time is saved.
In the past, temperature transmitters where primitive devices with rudimentary diagnostics only able to diagnose if the sensor was dead or alive. Today, temperature transmitters have sophisticated diagnostic able to detect if the temperature sensor is slowly degrading, and alerts before the sensor fails completely.
Pressure Transmitter Diagnostics
In the past, pressure transmitters where primitive devices with rudimentary diagnostics only able to diagnose if the sensor was dead or alive. Today, pressure transmitters have sophisticated diagnostic able to detect if the impulse line is plugging and other abnormal conditions such as detecting unexpected liquids in gas flow, or unexpected aeration in liquids, loss of agitation, and leaks.
In the past, pressure transmitters were not as intelligent as they are now, and original DD did not have the graphics display capability. Back then, intelligence and display for diagnostics had to be in dedicated programs or plug-in software that ran in a computer, for instance plug-in software for plugged impulse line detection.
Devices are getting ever more intelligent, and as devices get more intelligent, they are able to perform all functions internally round-the-clock. The result is graphically presented, without the need for external software.
Valve Positioner Diagnostics
A valve positioner is a sophisticated device with advanced diagnostics to monitor the health of the complete assembly including valve body, actuator, and the positioner itself. The positioner manufacturer organizes the diagnostics information logically using a hierarchical tree, tabbed cards, and frames thereby structuring the information to make the valve assembly easy to troubleshoot, on any control system.
Visual dial gauges are one way device manufacturers chose to present the information. Numeric values are very accurate, but numerical values running up and down make it hard to see if the value is increasing or decreasing, or changing faster or slower.
For a valve positioner, dial gage graphics makes it easy to visualize the actuator chambers vent or fill with air, just like the mechanical gauges for on the positioner itself. Thus graphics helps resolve problems with the pneumatics.
A valve positioner also tracks operational statistics such as total travel and the number of reversals (cycles). This is used as a more accurate estimate of actual wear and tear for more precise prediction of remaining life and scheduling of maintenance such as replacement or stem packing or seat etc.
Strip chart for trending is helpful for certain adjustments and therefore provided by the device manufacturer. Multiple values are often displayed in the same graphics.
The position histogram illustrates in which position the valve stem spends most of its time. This helps identify wrong valve sizing.
Valve positioners may also maintain an audit trail internally logging events such as failures in case the plant does not have device management software to provide this functionality.
Shutdown Valve Monitor Diagnostics
Special device are used to monitor emergency shutdown valves for which they periodically perform Partial Stroke Testing (PST). The results from the test are rendered graphically as a signature.
On/Off Valve Coupler Diagnostics
Diagnostics such as travel time, cycle counts, stuck valve, and possibly partial stroking for on/off valves is possible with fieldbus valve couplers, as well as the ability to tell if the solenoid is working or not.
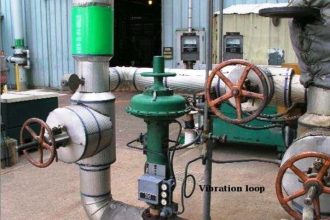
Vibration Transmitter Diagnostics
Vibration transmitters are slightly different in that they essentially are dedicated diagnostics devices. That is, the diagnostics is not so much for the transmitter itself, as it is for the machinery it is monitoring.
They monitor equipment like motors, pumps, fans, agitators, conveyor belts, and gears etc. to detect developing fault conditions like imbalance, misalignment, looseness, and latest age bearing problems.
Magnetic Flowmeter Diagnostics
In-situ meter verification tests the complete performance of a magnetic flowmeter to detect change in magnetic field strength, coil resistance, or electrode resistance to determine if calibration is needed.
Now it is possible to initiate the meter verification from any control system. Wizards created by the flowmeter manufacturer guide the technician step-bystep; no specialized training is required. Wizards may display percent completion for lengthy procedures so technicians know how much longer they need to wait.
Advanced diagnostics does not necessarily mean the presenting incomprehensible numerical values or charts that need interpretation. On the contrary, truly advanced diagnostics offers clear, actionable information. For instance, a clear pass or fail result. Test results may automatically be presented in a report, ready for print out from.
Some devices may combine illustrating graphics and explaining text on the same page
pH analyzer Diagnostics
Apart from measuring the pH, the analyzer continuously measures the impedance of the pH glass electrode and the reference electrode to detect sensor failure or degradation. High reference electrode impedance indicates the junction is plugged or that the filling solution or gel is depleted (dry).
A low glass electrode impedance indicates the glass is cracked, while a high impedance suggests it’s aging and nearing the end of its life.
Ultrasonic Flowmeter Diagnostics
Ultrasonic flowmeter diagnostics requires some baseline values to be set. A setup wizard created by the flowmeter manufacturer’s expert, guides the technician step-by-step, capturing the baseline values.
The flow profile and measured Speed of Sound are easily visualized and compared in bar graphs to identify build-up on transducers.
Gas Chromatograph (GC) Diagnostics
In the past, Gas Chromatograph (GC) diagnostics required proprietary software only a GC expert is qualified to use. Today fieldbus integrates the GC in the same software as other field instruments.
The GC manufacturer explains what is causing the problem and how to fix it. GC diagnostics may include: power failure, user calculation failure, warm start failed, heater out of range, flameout, flame over-temperature, no sample flow, low carrier pressure, and stream validation failure etc.
Electric Actuators / Motor Operated Valves (MOV) Diagnostics
Diagnostics from electric actuators such as overheating, over torque, actuator fail, lost control voltage, lost phase, motor overload, and valve stall etc. are communicated using fieldbus. Many internal variables are also available.


This is supperb initiative, common engineer must know fundamental of engineering. I would like to know more topics in detail.
I would like to know about importance of calibration ..