Fire and Gas (F&G) detection systems are essential for safeguarding industrial facilities, particularly in the oil and gas sector. An F&G Mapping Study is conducted to optimize detector placement, ensuring effective coverage of potential hazard zones while minimizing false alarms. This article details the methodology for conducting an F&G Mapping Study, setting performance-based targets, and establishing acceptance criteria.
Industry standards emphasis on risk-based, performance-driven approach to F&G detection. The key focus is on optimal detector placement, integration with safety systems, minimizing false alarms, and ensuring compliance with international standards.
2. Methodology for Conducting an F&G Mapping Study
2.1 Hazard Identification and Risk Assessment
The study begins with a hazard identification process based on available safety assessments such as Quantitative Risk Assessment (QRA) and Fire Safety Assessment (FSA).
The key objectives include:
- Identifying hazardous areas prone to fire and gas releases.
- Determining credible gas dispersion and fire scenarios.
- Assessing potential consequences of undetected hazards.
Sometimes CFD-based fire and gas dispersion modeling is required for optimization.
2.2 Selection of Detection Technology
The F&G detection system comprises various types of detectors:
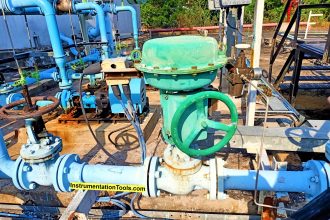
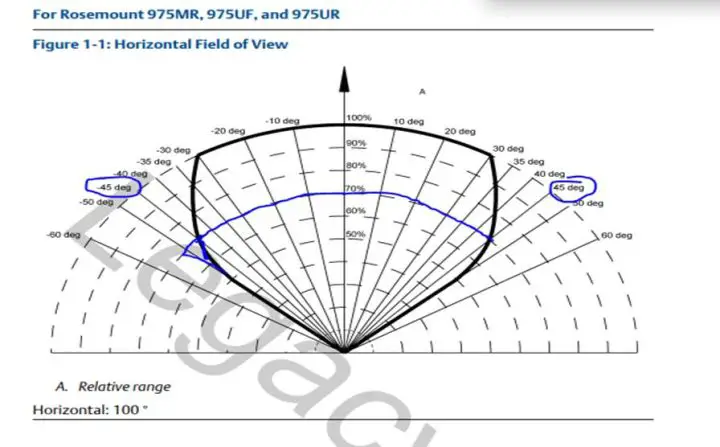
- Flame Detectors: Typically triple IR (3IR) with a cone of vision of 120° and a range of 18-30 meters.
- Point Infrared (IR) Gas Detectors: Installed near potential leak sources.
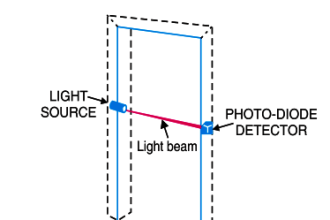
- Open Path (Line of Sight) Gas Detectors: Used in large open areas up to 60 meters.
| Sr No | Hazard | Detection |
| 1 | Fire | 3IR |
| 2 | Flammable Gas | IR point and Open Path |
| 3 | Toxic Gas | Electrochemical / Semiconductor |
2.3 Defining Target Coverage Areas
The facility is divided into sub-zones based on congestion, hazard potential, and process conditions.
2.4 Application of 3D Mapping Software
Advanced software tools are used for:
- Simulating gas cloud dispersion and flame propagation.
- Evaluating detector coverage efficiency.
- Optimizing detector placement.
3. Setting Performance-Based F&G Targets
3.1 Flame Detection Targets
- Larger fires have higher RHO and cause more severe burns in shorter exposure times.
- Flame detector range increases with fire size due to stronger infrared radiation.
- Higher RHO leads to faster detector response times and detected from long distance
- Response times vary depending on sensitivity settings and environmental conditions.
- Higher sensitivity settings increase false alarm risks, hence medium settings are preferred.
- Fire detection zones must be designed considering fire escalation risk and response time criteria.
The most commonly used historical method is through defining the size of the fire through its radiant heat output (RHO). The RHO of a design basis fire can be calculated through well-established correlations used for chemical process quantitative risk analysis for pool fires. When this type of approach is used on a 1 ft x 1ft n-heptane pool fire, and RHO in the range of 40-50 kW is the result. 1ft2 n-heptane pan fires produce approximately 40kW RHO.
RHO – Radiant Heat Output (kW) & D – Effective Viewing Distance of Flame Detector (m)
- Radiant energy from a fire behaves according to the inverse square law
- Meaning: radiant energy is proportional to the inverse square of the distance
- Hence as the viewing distance (D) increases, the amount of radiation required (size of flame) by the detector to ‘see’ the flame also increases.
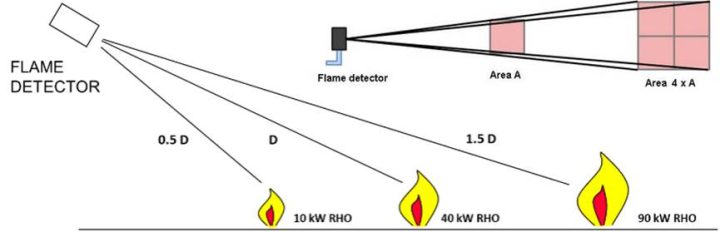
I₁ = 40 kW
d₁ = 1 meter
d₂ = 0.5 meters
Apply the Formula: I₁/I₂ = d1²/d2² and, I₂ will be 10kW
Similarly, if d₂ = 1.5 meter, I₂ becomes 90kW.
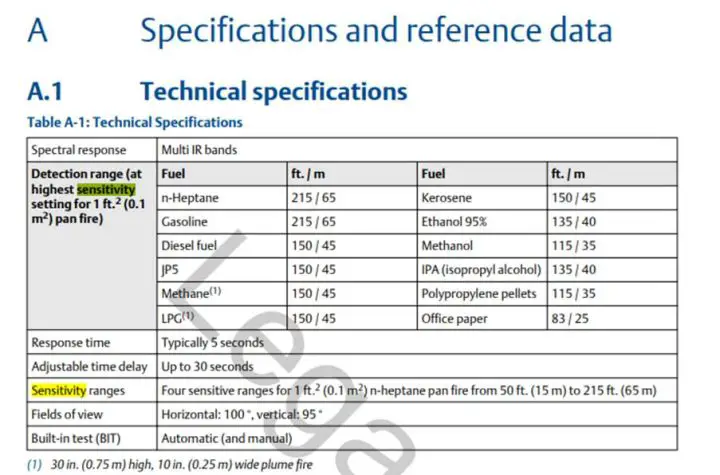
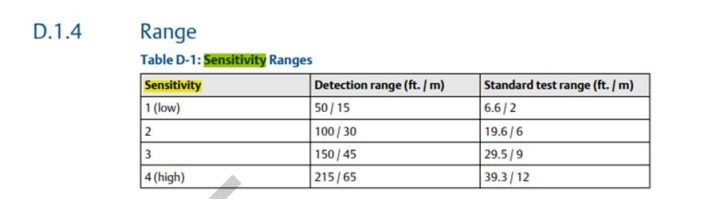
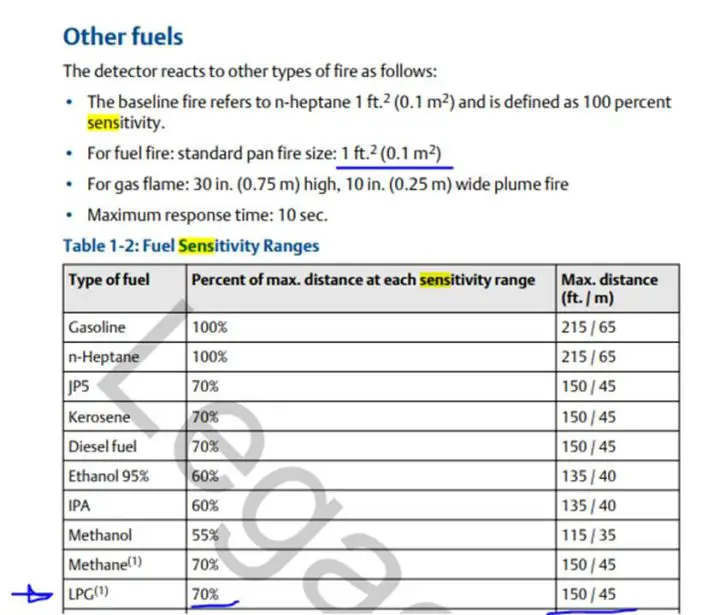
The factors like sensitivity, dirty objects, and field of view are considered for determining reference fire detection distance as OEM testing will be done in an ideal scenario.
If reference is taken as 40 kW radiant heat output (RHO) fire at 18 meters considering various factors then 100 kW RHO fire at 29 meters (using inverse square law) is considered for coverage and detector placement.
Sample Performance Coverage Criteria:
- 100kW RHO fire – 90% coverage for 1ooN configuration.
- 100kW RHO fire – 85% coverage for 2ooN configuration.
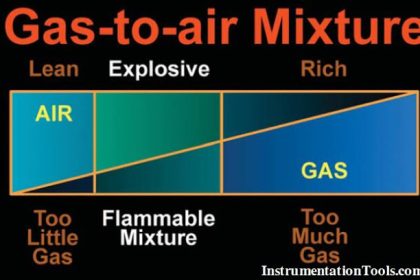
3.2 Gas Detection Targets
Gas Cloud Sizes:
- 5m sphere for enclosed areas.
- 7m sphere for partially enclosed/congested areas.
- 10m sphere for open areas.
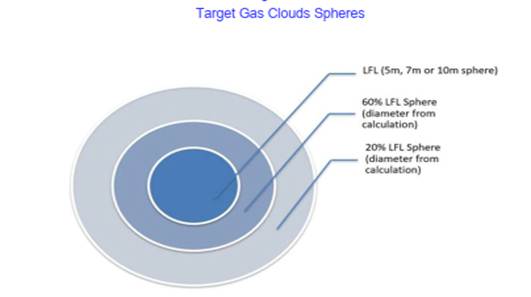
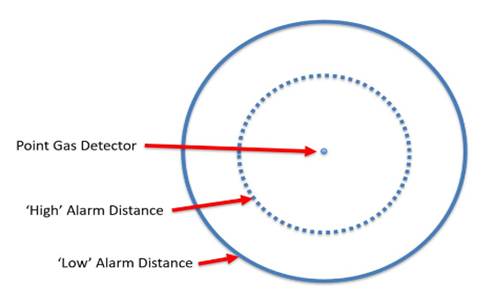
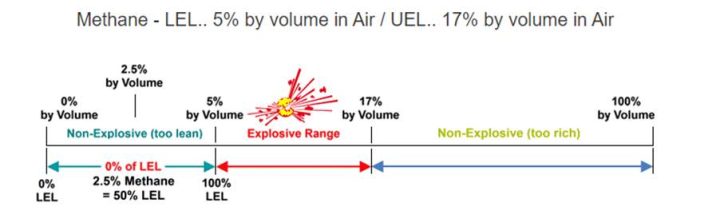
Detection Set Points
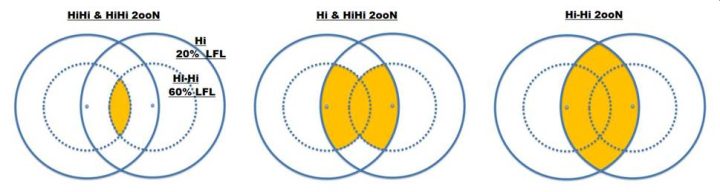
High Alarm at 20% LFL (1ooN) – For methane gas (20×5/100 = 1% by volume)
High-High Alarm at 60% LFL (2ooN) – For methane gas (60×5/100 = 3% by volume)
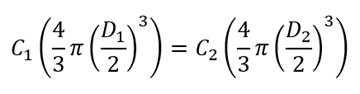
| 100% LFL (for methane 5% volume) for 7 meter distance | r2³ = (c1 / c2) * r1³ r2 = ³√((c1 / c2) * r1³) c1 = 100%r1 = 3.5 meterc2 = 20%r2 = 5.98 meter 20% LFL (for methane 1% volume) for 11 meter diameter cloud | r2³ = (c1 / c2) * r1³ r2 = ³√((c1 / c2) * r1³) c1 = 100%r1 = 3.5 meterc2 = 60%r2 = 4.15 meter 60% LFL (for methane 1% volume) for 8.3 meter diameter cloud |
| Volume = (4/3) * π * r³ | ||
| Radius = 7 meters / 2 = 3.5 meters.V = (4/3) * π * (3.5 meters)³V = approximately 179.59 cubic meters. |
Sample Performance Coverage Criteria:
- 11m Diameter Gas Cloud (20%LFL) – 90% coverage for 1ooN configuration.
- 8.3m Diameter Gas Cloud (60% LFL) – 85% coverage for 2ooN configuration.
4. Acceptance Criteria for F&G Mapping
4.1 Coverage Validation
Flame Detection:
- 90% of the fire zone should be within the Field of View (FoV) of at least one detector.
- 85% of the fire zone should be covered by two detectors for redundancy.
Gas Detection:
- Gas clouds should be detected within specified set points.
- Point detectors should consider wind patterns and leak sources.
– 90% of the coverage by at least one detector.
– 85% of the coverage by two detectors for redundancy.
4.2 Sensitivity and False Alarm Minimization
- Flame detectors should be set at medium sensitivity to avoid false alarms.
- Open Path Gas Detectors should maintain effective range.
- Point Gas Detectors should be located away from contamination sources.
4.3 Compliance with Industry Standards
The detection system should comply with:
- ISA TR84.00.07
- IEC 61508,
- IEC 61511
Client Specific Standard e.g. BP GP 30-85, ADNOC AGES-PH-04-001 / AGES-PH-03-002
5. Conclusion
A well-designed F&G Mapping Study ensures robust fire and gas detection by using structured methodologies, performance-based targets, and stringent acceptance criteria. By leveraging 3D mapping tools and industry best practices, facilities can enhance safety, minimize false alarms, and achieve regulatory compliance.
The instrument and control engineer should understand the concept and select the F&G detectors meeting the performance target set in the F&G Mapping study.
This article was to provide a brief overview of F&G mapping. Users are advised to get expert guidance/consultation for F&G mapping for your plant or facility.
Read Next:
- Fire Fighting System
- Industrial Flame Detectors
- Gas Detectors Practical Problems
- Ultrasonic Gas Leak Detectors
- Infrared Open Path Gas Detector