The flow regulation in a valve is accomplished by the varying resistance as the valve is stroked, i.e. its effective cross sectional area is changed. As the fluid moves from the piping into the smaller diameter orifice of the valve, its velocity increases to enable mass flow through the valve.
The energy needed to increase the velocity comes at the expense of the pressure, so the point of highest velocity is also the point of lowest pressure (smallest cross section).
The point where the pressure is at the lowest is called “vena contracta”. To display the general behavior of flow through a control valve, the valve is simplified to an orifice in a pipeline as shown in the figure below:
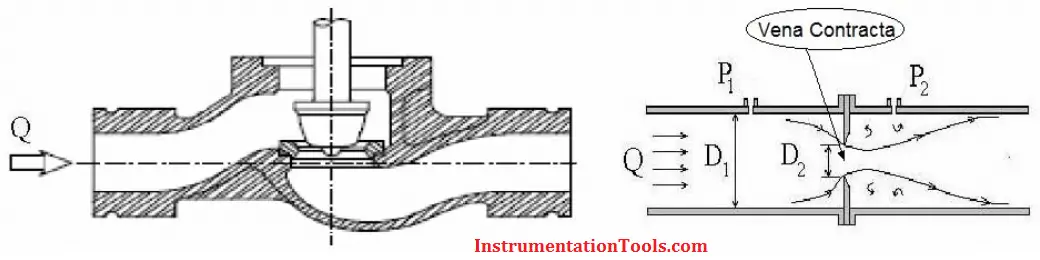
As the liquid passes the point of greatest restriction (vena contracta); its velocity reaches a maximum and its pressure falls to a minimum.
Hence we would expect the highest velocity at the internal to the valve than on upstream and downstream. Beyond the vena contracta, the fluid’s velocity will decrease as the diameter of piping increases.
This allows for some pressure recovery as the energy that was imparted as velocity is now partially converted back into pressure (refer pressure-velocity profile below).
It is important to understand how the pressure-velocity conditions change as the fluid passes through the restriction. This is best described by the continuity equation:
Where:
The equation shows that the velocity and hence the pressure can be changed by adjusting the valve opening (area). With this introduction, we will jump straight to control valve basics and the readers interested in further reading should read the basic principles of hydraulics.
For sizing a control valve we are interested in knowing how much flow we can get through the valve for any given opening of the valve and for any given pressure differential.
The relationship between pressure drop and flow rate through a valve is conveniently expressed by a flow coefficient (Cv).
Flow coefficient (Cv) is defined as the number of gallons per minute (gpm) at 60°F that will pass through a full open valve with a pressure drop of 1 psi.
Simply stated, a control valve which has a Cv of 12 has an effective port area in the full open position such that it passes
12gpm of water with 1 psi pressure drop. The Cv for water is usually determined experimentally by measuring the flow through a valve with 1 psi applied pressure to the valve inlet and have a 0 psi pressure at the outlet.
For incompressible fluids like water, a close approximation can be found mathematically by the following equation;
Where,
The equation shows that the flow rate varies as the square root of the differential pressure across the control valve. Greater the pressure drop, higher will be the flow rate.
Pressure drop across a valve is highly influenced by the area, shape, path and roughness of the valve.
The flow coefficient (Cv) equation illustrates that the flow rate through a valve (Q) increases with the pressure differential (∆P).
Simply stated, as the pressure drop across the valve gets larger, more flow will be forced through the restriction due to the higher flow velocities.
In reality, the above relationship only holds true over a limited range. As the pressure drop across the valve is increased, it reaches a point where the increase in flow rate is less than expected.
This continues until no additional flow can be passed through the valve regardless of the increase in pressure drop. This condition is known as choked flow.
Choked flow (otherwise known as critical flow) takes place:
To understand more about what is occurring, it is necessary to return to the basics again. Recall that as a liquid passes through a restriction, the velocity increases to a maximum and the pressure decreases to a minimum.
As the flow exits, velocity is restored to its previous value, while the pressure never completely recovers, thus creating a pressure differential across the valve.
If the pressure differential is sufficiently large, the pressure may, at some point, decrease to less than the vapor pressure of the liquid. When this occurs, the liquid partially vaporizes and is no longer incompressible.
It is necessary to account for choked flow during the sizing process to ensure against undersizing a valve. In other words, it is necessary to know the maximum flow rate that a valve can handle under a given set of conditions.
When selecting a valve, it is important to check the pressure recovery characteristics of valves for the thermodynamic properties of the fluid. High recovery valves, such as ball and butterfly, will become choked at lower pressure drops than low recovery valves such as globe which offer a more restricted flow path when fully open.
As previously mentioned, at the point where the fluid’s velocity is at its highest, the pressure is at its lowest.
Assuming the fluid is incompressible (liquid), if the pressure falls below the liquid’s vapor pressure, vapor bubbles form within the valve and collapse into themselves as the pressure increases downstream.
This leads to massive shock waves that are noisy and will certainly ruin the equipment.
Under such scenario, there are two phases flowing downstream of the valve: liquid and vapor. Flashing cannot be eliminated in the valve if the downstream pressure is less than the vapor pressure of liquid.
However, the damage can be minimized by:
Cavitation is similar to flashing in a way that the liquid pressure drops to value below its vapor pressure, causing a liquid to vaporize into vapor bubbles.
Both cavitation and flashing occurs because the pressure energy in a fluid is converted to kinetic energy due to the contraction at the valve closure member, causing an increase in velocity.
In addition, as the temperature of the liquid increases, the likelihood of cavitation becomes more likely because of the increased vapor pressure. The extent of the cavitation depends mainly on the downstream pressure and the differential pressure across the valve.
The difference is that with the cavitation phenomenon, the liquid pressure increases over its vapor pressure during pressure recovery and turns back into liquid state while during flashing the liquid pressure remains below the vapor pressure throughout.
The key differences are:
If cavitation is ever encountered, consider the following corrective actions:
Valve recovery refers to the pressure recovery from the low pressure at vena contracta to the valve outlet. The term “valve recovery” is usually applied when a valve is employed as a restriction.
It is a given that any valve could cause cavitation to a differing degree and in different closure positions. If using a valve to cause a pressure drop as compared to control the flow of volume, it is safe to say that a low recovery valve will resist causing cavitation more than a high recovery type.
The valve recovery coefficient is a dimensionless, numerical factor that represents a valve’s flow vs. liquid pressure curve, and thus the valve’s tendency to cavitate. If this factor is higher than desired, cavitation might develop.
The valve coefficient is affected by the internal geometry of the valve, valve size, pressure, and the presence or absence of piping reducers adjacent to the valve.
Also Read: Valves Characteristics
Lube oil consoles of rotary equipment packages in industrial process plants are usually equipped with…
Rotating equipment packages such as pumps, compressors, turbines need the lube oil consoles for their…
This article explains how to blink lights in ladder logic with a detailed explanation video…
In this article, a simple example will teach you the conversion from Boolean algebra to…
In this article, you will learn the PLC cooking timer example for kitchen automation using…
Learn an example PLC program to control a pump based on level sensors using ladder…


