Inst ToolsInst ToolsInst Tools
  • Courses
  • Automation
    • PLC
    • Control System
    • Safety System
    • Communication
    • Fire & Gas System
  • Instrumentation
    • Design
    • Pressure
    • Temperature
    • Flow
    • Level
    • Vibration
    • Analyzer
    • Control Valve
    • Switch
    • Calibration
    • Erection & Commissioning
  • Interview
    • Instrumentation
    • Electrical
    • Electronics
    • Practical
  • Q&A
    • Instrumentation
    • Control System
    • Electrical
    • Electronics
    • Analog Electronics
    • Digital Electronics
    • Power Electronics
    • Microprocessor
  • Request
Search
  • Books
  • Software
  • Projects
  • Process
  • Tools
  • Basics
  • Formula
  • Power Plant
  • Root Cause Analysis
  • Electrical Basics
  • Animation
  • Standards
  • 4-20 mA Course
  • Siemens PLC Course
Reading: Inspecting the Trends of PV and SP on a Process Chart Recorder
Share
Font ResizerAa
Inst ToolsInst Tools
Font ResizerAa
  • Courses
  • Design
  • PLC
  • Interview
  • Control System
Search
  • Courses
  • Automation
    • PLC
    • Control System
    • Safety System
    • Communication
    • Fire & Gas System
  • Instrumentation
    • Design
    • Pressure
    • Temperature
    • Flow
    • Level
    • Vibration
    • Analyzer
    • Control Valve
    • Switch
    • Calibration
    • Erection & Commissioning
  • Interview
    • Instrumentation
    • Electrical
    • Electronics
    • Practical
  • Q&A
    • Instrumentation
    • Control System
    • Electrical
    • Electronics
    • Analog Electronics
    • Digital Electronics
    • Power Electronics
    • Microprocessor
  • Request
Follow US
All rights reserved. Reproduction in whole or in part without written permission is prohibited.
Inst Tools > Blog > Practical Questions > Inspecting the Trends of PV and SP on a Process Chart Recorder

Inspecting the Trends of PV and SP on a Process Chart Recorder

Inspecting the trends of PV and SP on a process chart recorder, you notice the poor quality of control loop.

Last updated: March 9, 2021 9:04 pm
Editorial Staff
Practical Questions
No Comments
Share
1 Min Read
SHARE

Inspecting the trends of PV and SP on a process chart recorder, you notice the poor quality of control:

Trends of PV and SP

Trends of PV and SP on a process chart

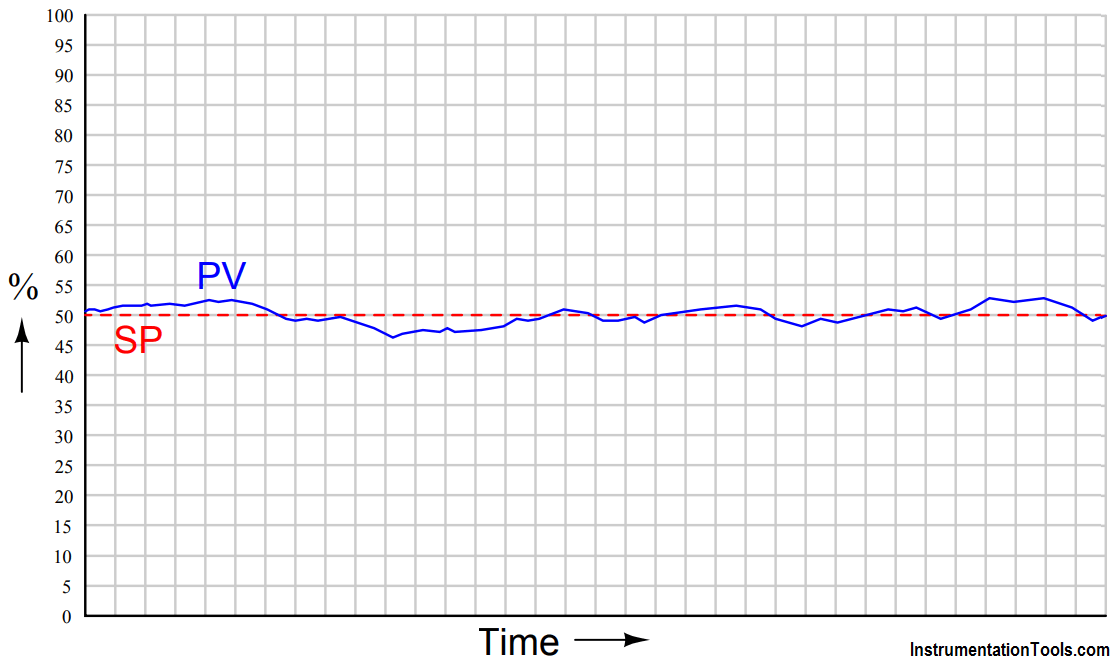
The “wandering” of the process variable (PV) around setpoint may be due to excessive action on the part of the controller, or it may be due to load fluctuations in the process itself.

In other words, the instability may be the fault of the controller reacting too aggressively, or it may be that the controller is not working aggressively enough to counter changes in process load.

Identify a simple method to determine which scenario is true.

Hint: the way to check is as simple as pushing a single button, in most cases.

Answer:

Place the controller in manual mode and observe the PV trend!

Share your answers through below comments section.

Read Next:

  • How to Calibrate Load Cells?
  • PID Controller Theory
  • What is a Recorder?
  • PM of Instrument Compressor
  • How to Read Circular Chart Recorder

Credits: Tony R. Kuphaldt

Don't Miss Our Updates
Be the first to get exclusive content straight to your email.
We promise not to spam you. You can unsubscribe at any time.
Invalid email address
You've successfully subscribed !

Continue Reading

Identify the Pressure Gauge Error
Pressure Level Transmitter Problems
Practical Process Control System Questions & Answers – 11
Calculate the Height of Glycerine
Thermocouple Terminal block Questions
Air Compressor Control Circuit Problem
Share This Article
Facebook Whatsapp Whatsapp LinkedIn Copy Link
Share
Leave a Comment

Leave a Reply Cancel reply

Your email address will not be published. Required fields are marked *

Stay Connected

128.3kFollowersLike
69.1kFollowersFollow
210kSubscribersSubscribe
38kFollowersFollow

Categories

Explore More

How Much Pressure Indicated by Micromanometer?
DP Transmitter Located 10 feet Beneath the Vessel
PLC Program to Control a Water Pump
Programmable Logic Controller (PLC) Questions and Answers – 16
PLC Pump Permissive Interlocks
Programmable Logic Controller (PLC) Questions and Answers – 4
Solenoid Valves Questions & Answers – 1
Flapper Nozzle Questions

Keep Learning

pressure switch ladder-logic diagram

Draw the appropriate Pressure Switch Symbol ?

Two solenoid valves circuit

Solenoid Valves Questions & Answers – 4

Determine Calibration Range of Pneumatic Pressure Transmitter

Determine Calibration Range of Pneumatic Pressure Transmitter

Baffle Nozzle Assembly Sensitive Mechanism

Baffle Nozzle Assembly Sensitive Mechanism

Determine Resistance value of Resistors

Determine Resistance value of Resistors

Bourdon Tube Gauge Spiral Spring

What is the Purpose of Bourdon Tube Gauge Spiral Spring?

AB PLC Temperature Switch

Programmable Logic Controller (PLC) Questions and Answers – 17

hydraulic module

Identify all Spool Valve Positions

Learn More

Ultrapure Water in the Semiconductor Industry

Ultrapure Water in the Semiconductor Industry

microwave flow detector applications

Microwave Flow Sensor – Working Principle and Applications

Magnetostrictive Level Transmitter Working Principle

Magnetostrictive Level Transmitter Working Principle

Paddle switch Working Principle

Paddle Switch Working Principle

Capacitor and Symbols

Capacitance

Electronic Devices & Circuits Objective Questions

Electronic Devices & Circuits Quiz – Set 8

Power Systems Projects

400+ Power Systems Projects – Best Electrical Project Ideas

Comparison of Proportional Integral Derivative Controllers (PID)

Comparison of Proportional Integral Derivative Controllers (PID)

Menu

  • About
  • Privacy Policy
  • Copyright

Quick Links

  • Learn PLC
  • Helping Hand
  • Part Time Job

YouTube Subscribe

Follow US
All rights reserved. Reproduction in whole or in part without written permission is prohibited.
Welcome Back!

Sign in to your account

Username or Email Address
Password

Lost your password?