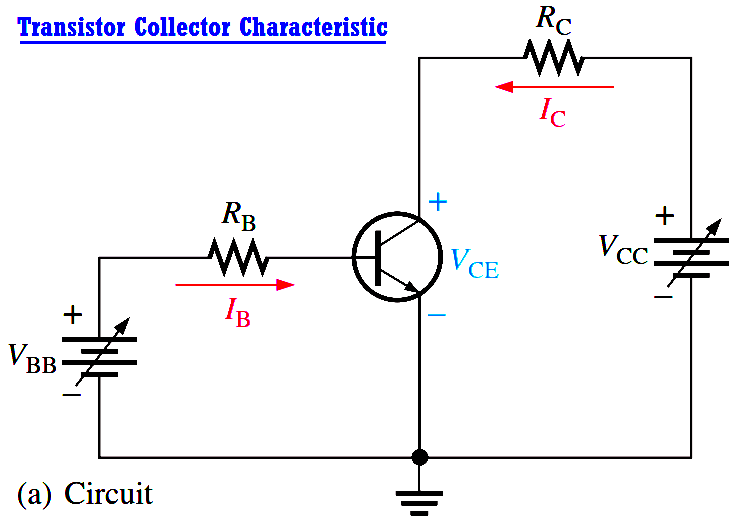
Using a circuit like that shown in Figure (a), a set of collector characteristic curves can be generated that show how the collector current, IC, varies with the collector-to-emitter voltage, VCE, for specified values of base current, IB. Notice in the circuit diagram that both VBB and VCC are variable sources of voltage.
Assume that VBB is set to produce a certain value of IB and VCC is zero. For this condition, both the base-emitter junction and the base-collector junction are forward-biased because the base is at approximately 0.7 V while the emitter and the collector are at 0 V. The base current is through the base-emitter junction because of the low impedance path to ground and, therefore, IC is zero. When both junctions are forward-biased, the transistor is in the saturation region of its operation. Saturation is the state of a BJT in which the collector current has reached a maximum and is independent of the base current.
As VCC is increased, VCE increases as the collector current increases. This is indicated by the portion of the characteristic curve between points A and B in Figure (b). IC increases as VCC is increased because VCE remains less than 0.7 V due to the forward-biased base-collector junction.
Ideally, when VCE exceeds 0.7 V, the base-collector junction becomes reverse-biased and the transistor goes into the active, or linear, region of its operation. Once the base-collector junction is reverse-biased, IC levels off and remains essentially constant for a given value of IB as VCE continues to increase. Actually, IC increases very slightly as VCE increases due to widening of the base-collector depletion region. This results in fewer holes for recombination in the base region which effectively causes a slight increase in βDC. This is shown by the portion of the characteristic curve between points B and C in Figure (b). For this portion of the characteristic curve, the value of IC is determined only by the relationship expressed as IC = βDCIB.
When VCE reaches a sufficiently high voltage, the reverse-biased base-collector junction goes into breakdown; and the collector current increases rapidly as indicated by the part of the curve to the right of point C in Figure (b). A transistor should never be operated in this breakdown region.
A family of collector characteristic curves is produced when IC versus VCE is plotted for several values of IB, as illustrated in Figure (c). When IB = 0, the transistor is in the cutoff region although there is a very small collector leakage current as indicated. Cutoff is the nonconducting state of a transistor. The amount of collector leakage current for IB = 0 is exaggerated on the graph for illustration.
Rotating equipment packages such as pumps, compressors, turbines need the lube oil consoles for their…
This article explains how to blink lights in ladder logic with a detailed explanation video…
In this article, a simple example will teach you the conversion from Boolean algebra to…
In this article, you will learn the PLC cooking timer example for kitchen automation using…
Learn an example PLC program to control a pump based on level sensors using ladder…
In the PLC timer application for security camera recording, when motion is detected then camera…


