An electrical single line diagram abbreviated as SLD is also referred to as a one-line diagram. It is a simplified drawing of the whole system or a portion of the power system that shows the electrical placement of all major equipment.
A single line diagram is a simplified explanation for representing a three-phase power system.
The required information is added to give the engineer or a system operator the full picture of the electrical system. It also includes the system protection schemes.
Line crew: Single line diagram drawing tells the worker at a glance where the disconnecting means is located. It shows how all alternate sources may be isolated.
System operators: Use the single-line diagrams to identify the electrical placement of breakers, switches, transformers, regulators, and so on in substations that may indicate alarms. The restoration of power can be possible by identifying.
Electrical engineers: Use single line diagrams to understand system behavior and to make changes to the power system to improve performance.
End-users: Use the single-line diagrams to identify their electrical equipment, circuits, and protection apparatus.
Familiarity:
Familiarity with electrical symbols helps one to understand the overall system connections.
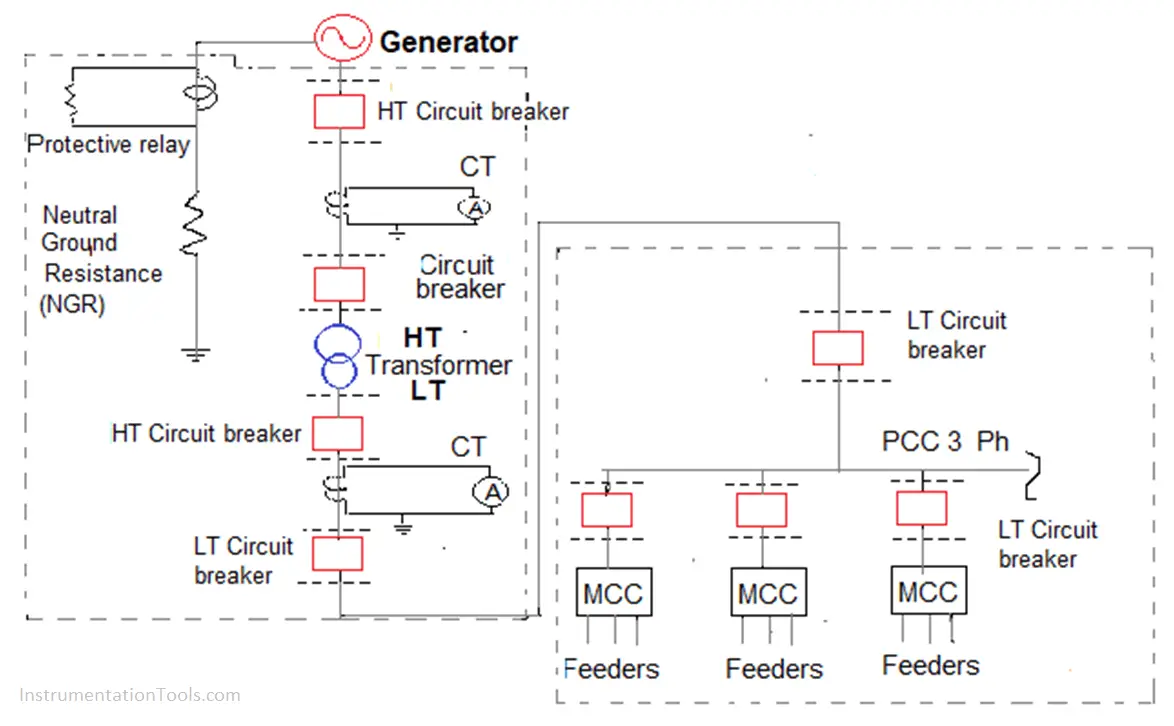
The above single line diagram shows right from generation to distribution stage. From the above one-line drawing, one can easily understand that the line shown from power generation, number breakers, HT/LT transformer, power control Center (PCC), then Motor control center, finally to feeders.
The red box represents the circuit breakers. The blue circle overlapped represents the transformer from HT to LT power. Greyline represents three-phase power in a single conductor.
The single line diagram is divided into two portions, from generation to substation are shown in a dotted grey line box. Another box represents the power control center, motor control centers and connecting them with feeders.
Current transformers are shown in two places with indicators.
A neutral ground resistor (NGR) is shown connected to a neutral line to provide protection to the generator against earth faults.
Circuit breakers are shown at various places for isolation of power for the transformer, PCC, and MCC.
Read Next:
The conveyor sorting machine is widely used in the packing industries using the PLC program…
Learn the example of flip-flop PLC program for lamps application using the ladder logic to…
In this article, you will learn the STAR DELTA programming using PLC controller to start…
Lube oil consoles of rotary equipment packages in industrial process plants are usually equipped with…
Rotating equipment packages such as pumps, compressors, turbines need the lube oil consoles for their…
This article explains how to blink lights in ladder logic with a detailed explanation video…

View Comments
Send more about motor control wiring diagram
Its educating ways for md, so for thanks.