Flow Transmitter output in square-root value and chart recorder prints flow value in the range of 0 to 100%.
The simplified formula for the gas flow is
Q = C √ (h P )
Where
Q = Quantity of gas (cu. Ft.) flowing for any given period
C = Coefficient for the same period
h = average differential pressure for that period
P = average absolute static pressure for that period.
Please find here below a Circular Chart and method how to read flow measurement.
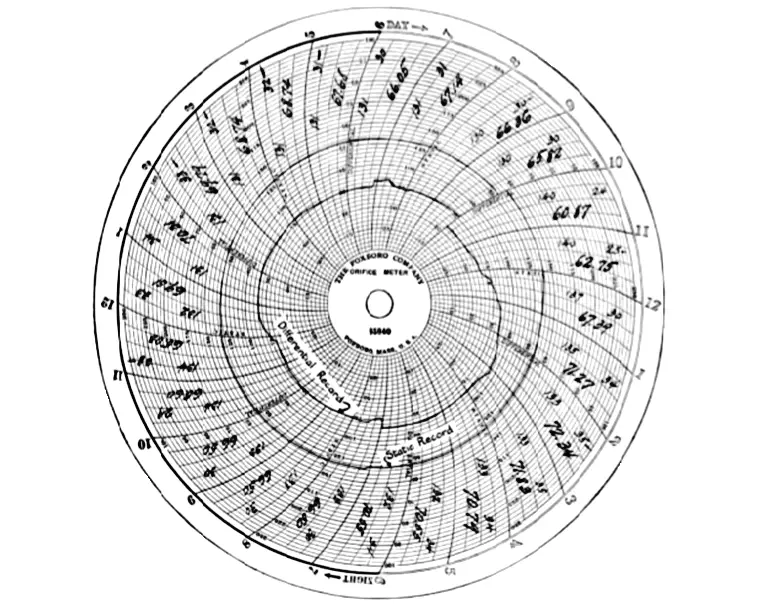
Figure 1
The square root of the values of h and P, must be determined as a part of the computation, and reference table as shown below made to facilitate for convenience.
There are three methods of computing orifice meter charts
When gas is passing for fully twenty four hour and charts are readable for the entire period.
This may be handled in either one of the two ways. The readings for each fifteen minute or hourly period may be set down directly on the chart, together with their corresponding extensions. The extension is the product of the square root of h and P, found in the below table.
Extreme care must be used to see that the differential and static readings are taken for corresponding periods.
The total number of extensions in Figure -1 or Table – 1 is 1628.61 upon rounded to four significant figures, this amount becomes 1629. If this is multiplied by assumed hourly coefficient of 300 gives 488,700 which is daily flow of gas in Cu.Ft.
If you liked this article, then please subscribe to our YouTube Channel for Instrumentation, Electrical, PLC, and SCADA video tutorials.
You can also follow us on Facebook and Twitter to receive daily updates.
Read Next:
In this post, we will learn the basic requirements for a network switch to be…
The PLC panel and MCC panel interface signals are start, stop, run feedback, trip, local…
In this article, we are going to discuss about shutter door control using induction motor…
Electrical Drives control the motion of electric motors. Motion control is required in industrial and…
PLC ladder logic design to control 3 motors with toggle switch and explain the program…
VFD simulator download: Master the online tool from the Yaskawa V1000 & programming software for…


View Comments
thanks for the article but you didn't mentioned the last tow methodes and how to use them