In industrial automation systems, operators and engineers often rely on both trend screens and generated reports to analyze process performance. However, a common issue arises when the data shown in reports does not match what is observed on the trends screen. This inconsistency can create confusion, reduce trust in the system, and make troubleshooting more difficult.
Reports Showing Different Data
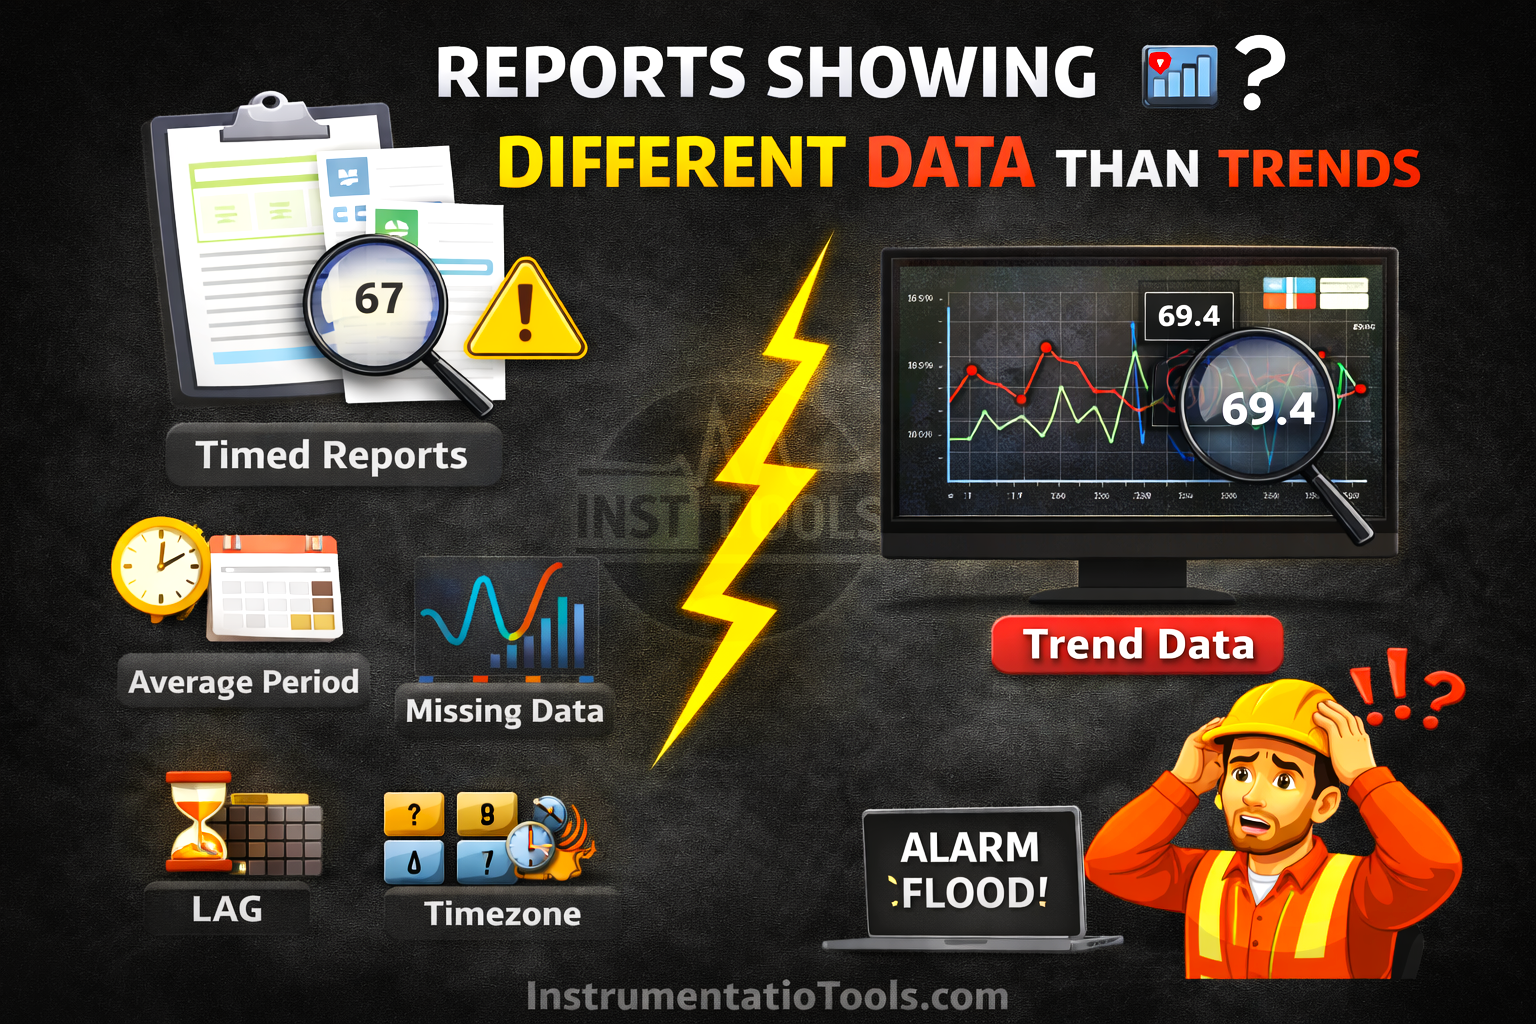
Although both views originate from the same process signals, differences in data handling, storage, and presentation can lead to noticeable variations. Understanding why these mismatches occur is essential for ensuring accurate analysis and reliable decision-making.
Difference in data sampling methods
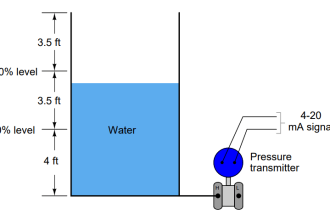
One of the primary reasons for the mismatch between reports and trend screens is the difference in how data is sampled. Trend screens are designed to give operators a near real-time view of the process, so they typically capture and display data at very high frequencies, sometimes every second or even faster. This allows them to show rapid fluctuations, spikes, or short-duration events very clearly.
On the other hand, reports usually depend on stored data from a historian or database, where values are not always recorded at such high frequency. Instead, data may be logged at fixed intervals (for example, every 1 minute or 5 minutes) or only when there is a significant change in the value. Because of this, short-lived variations that are visible in the trend may be completely missed in the report. As a result, the report may appear smoother or slightly different compared to the trend, even though both are technically correct within their respective sampling methods.
Data compression and storage techniques
Another important factor is how data is stored in the historian. To optimize storage space and system performance, most historians use data compression techniques. Instead of storing every single data point, the system records values only when there is a meaningful change beyond a defined threshold. Minor fluctuations are often ignored or approximated.
In contrast, trend screens may display interpolated or more granular data, giving the impression of continuous variation. Because of compression, the stored data used for reports may not include all the small intermediate changes that were visible on the trend. This results in reports appearing smoother or slightly different, especially in processes where values fluctuate frequently but within a small range.
Time synchronization issues
Another common cause of a mismatch is improper time synchronization between different components of the system. In a typical setup, PLCs, SCADA servers, and historians may each have their own internal clocks. If these clocks are not perfectly aligned, even a small difference of a few seconds can lead to noticeable data discrepancies.
For example, a trend screen might display a value exactly at a given timestamp based on the SCADA system time, while the report retrieves data from the historian using a slightly different timestamp. In fast-changing processes, this small time shift can result in different values being captured. Over longer durations, these minor misalignments can accumulate, making the report data appear inconsistent with the trends.
Aggregation and calculation differences
Reports often present processed data rather than raw values. They typically apply calculations such as averages, minimums, maximums, or totals over a defined time interval (for example, 15 minutes, 1 hour, or a full day). This helps in summarizing large volumes of data into meaningful insights.
In contrast, trend screens usually display instantaneous values at specific points in time. Because of this, a value seen on the trend at a particular second may not match the value shown in a report, which could be an average of hundreds or thousands of data points within that same period. This difference in how data is calculated and presented naturally leads to variations, even though both representations are correct in their own context.
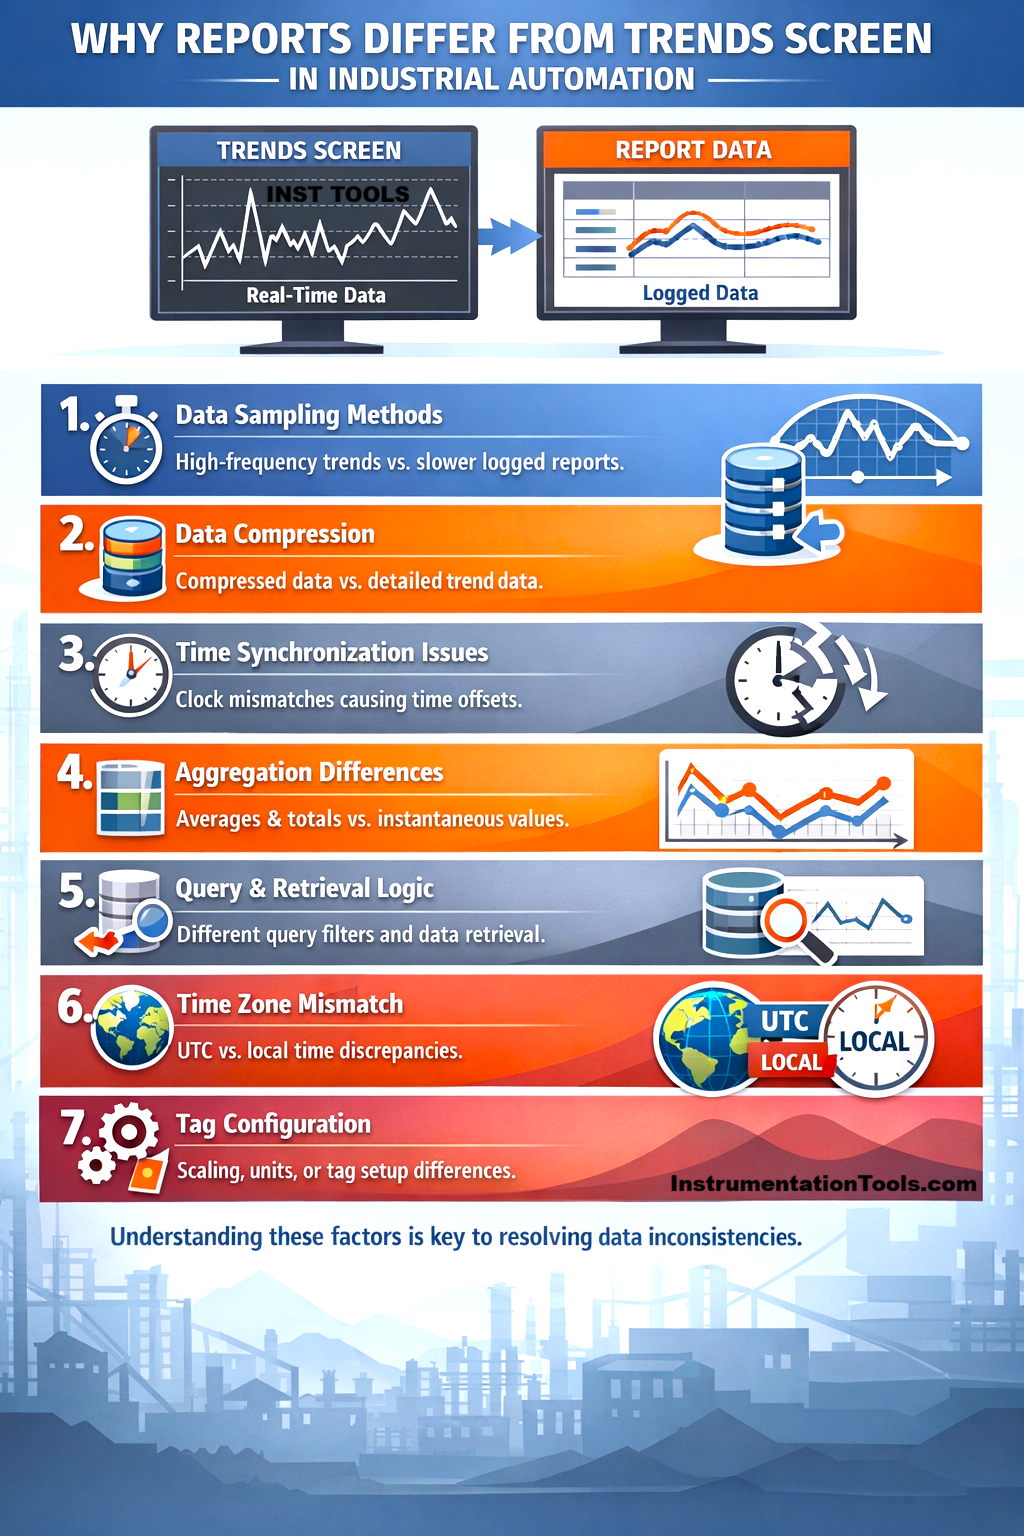
Data retrieval and query logic
Reports rely on database queries to fetch data from the historian, and the way these queries are written can significantly impact the results. Factors such as selected time range, filtering conditions, interpolation methods, and data boundaries (start and end timestamps) all influence what data is returned.
For example, a report may use interpolated values at fixed intervals, while the trend screen might display actual recorded points. Similarly, slight differences in start and end time selection, such as including or excluding boundary values, can lead to mismatched results. Even rounding or formatting applied during query execution can introduce small variations. As a result, inconsistencies between report queries and trend data retrieval logic can cause noticeable differences in the displayed values.
Time zone or format mismatch
Sometimes the difference is not in the data itself, but in how time is interpreted. Reports and trend screens may use different time zones, such as local system time versus UTC, or different time formats. This can shift the data window being viewed without it being immediately obvious.
For instance, a report generated in UTC may appear to show different values compared to a trend screen displaying local time, even though both are correct for their respective time frames. Similarly, differences in date formats or daylight saving adjustments can lead to selecting slightly different time ranges. This misalignment makes it seem like the data is inconsistent, when in reality the systems are referencing different time periods.
In this way, we saw how reports can show different data from trends.