Inst ToolsInst ToolsInst Tools
  • Courses
  • Automation
    • PLC
    • Control System
    • Safety System
    • Communication
    • Fire & Gas System
  • Instrumentation
    • Design
    • Pressure
    • Temperature
    • Flow
    • Level
    • Vibration
    • Analyzer
    • Control Valve
    • Switch
    • Calibration
    • Erection & Commissioning
  • Interview
    • Instrumentation
    • Electrical
    • Electronics
    • Practical
  • Q&A
    • Instrumentation
    • Control System
    • Electrical
    • Electronics
    • Analog Electronics
    • Digital Electronics
    • Power Electronics
    • Microprocessor
Search
  • Books
  • Software
  • Projects
  • Process
  • Tools
  • Basics
  • Formula
  • Power Plant
  • Root Cause Analysis
  • Electrical Basics
  • Animation
  • Standards
  • 4-20 mA Course
  • Siemens PLC Course
Reading: Dispersive Spectroscopy
Share
Notification Show More
Font ResizerAa
Inst ToolsInst Tools
Font ResizerAa
  • Courses
  • Design
  • PLC
  • Interview
  • Control System
Search
  • Courses
  • Automation
    • PLC
    • Control System
    • Safety System
    • Communication
    • Fire & Gas System
  • Instrumentation
    • Design
    • Pressure
    • Temperature
    • Flow
    • Level
    • Vibration
    • Analyzer
    • Control Valve
    • Switch
    • Calibration
    • Erection & Commissioning
  • Interview
    • Instrumentation
    • Electrical
    • Electronics
    • Practical
  • Q&A
    • Instrumentation
    • Control System
    • Electrical
    • Electronics
    • Analog Electronics
    • Digital Electronics
    • Power Electronics
    • Microprocessor
Follow US
All rights reserved. Reproduction in whole or in part without written permission is prohibited.
Inst Tools > Blog > Analyzers > Dispersive Spectroscopy

Dispersive Spectroscopy

Last updated: August 25, 2018 9:25 am
Editorial Staff
Analyzers
No Comments
Share
4 Min Read
SHARE

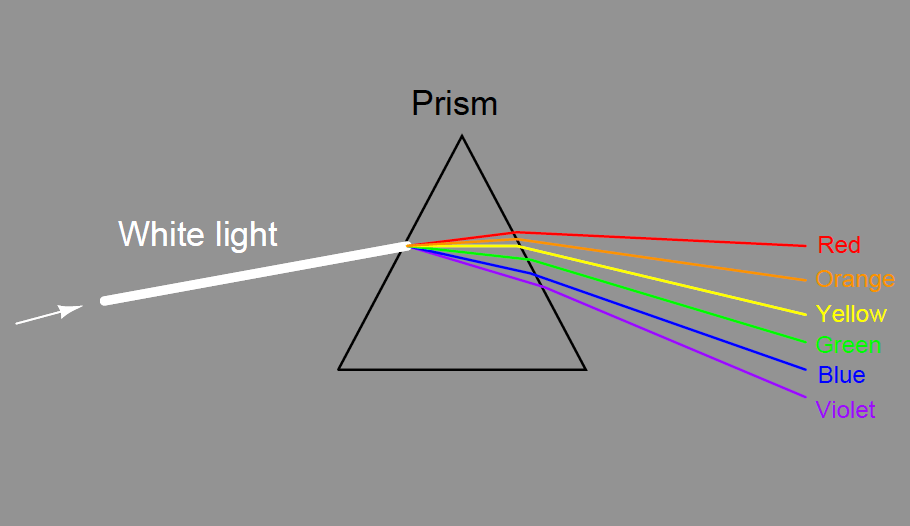
The dispersion of visible light into its constituent colors goes all the way back to the 17th century with Isaac Newton’s experiments, taking a glass prism and generating the characteristic “rainbow” of colors:

Dispersive spectroscopy

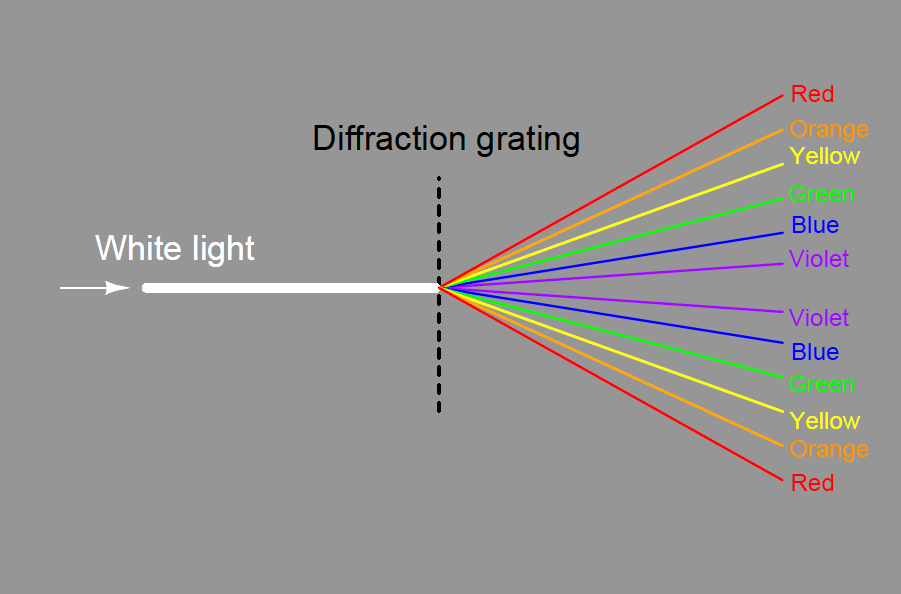
A modern variation on the theme of a solid glass prism is a thin diffraction grating, causing light of different wavelengths to “bend” as they pass through a series of very thin slits:

diffraction grating

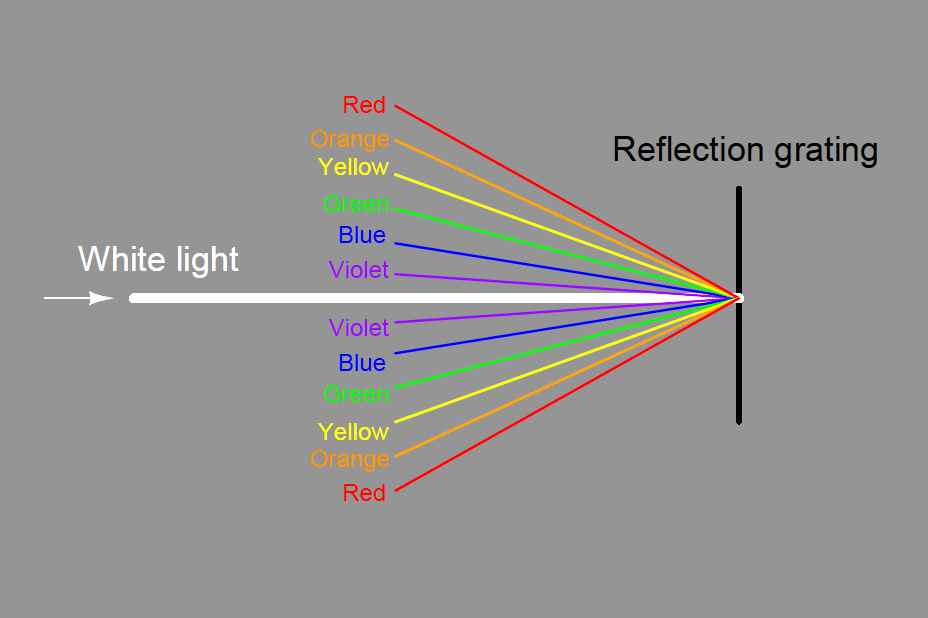
Some dispersive analyzers use a reflection grating instead of a refraction grating. Reflection gratings use fine lines etched on a reflective (mirror) surface to produce an equivalent dispersive effect to a diffraction grating :

dispersive analyzers

In 1814, the German physicist Joseph von Fraunhofer closely analyzed the spectrum of colors obtained from sunlight and noticed the existence of several dark bands in the otherwise uninterrupted spectrum where specific colors seemed to be attenuated. Later that century, experiments by the French physicist Jean Bernard L´eon Foucault and the German physicist Gustav Robert Kirchoff confirmed the same effect when white light was passed through a vapor of sodium. They correctly reasoned that the sun’s core produced a continuous spectrum of light (all wavelengths) due to its incredibly high temperature, but that certain gaseous elements (including sodium) in the cooler, outer “atmosphere” of the sun were absorbing some of the wavelengths to cause the Fraunhofer lines in the observed spectrum. These scientists noted the same patterns of absorption (dark lines) in the sun’s spectrum that appeared in laboratory absorption tests with sodium. The implication of these scientists’ experiments are truly staggering, as they were able to correctly identify gaseous elements in a sample 93 million miles distant from Earth!.

This sort of spectrographic analysis is called dispersive, because it relies on a device such as a prism or diffraction grating to disperse the different wavelengths of light from each other so they may be independently measured.

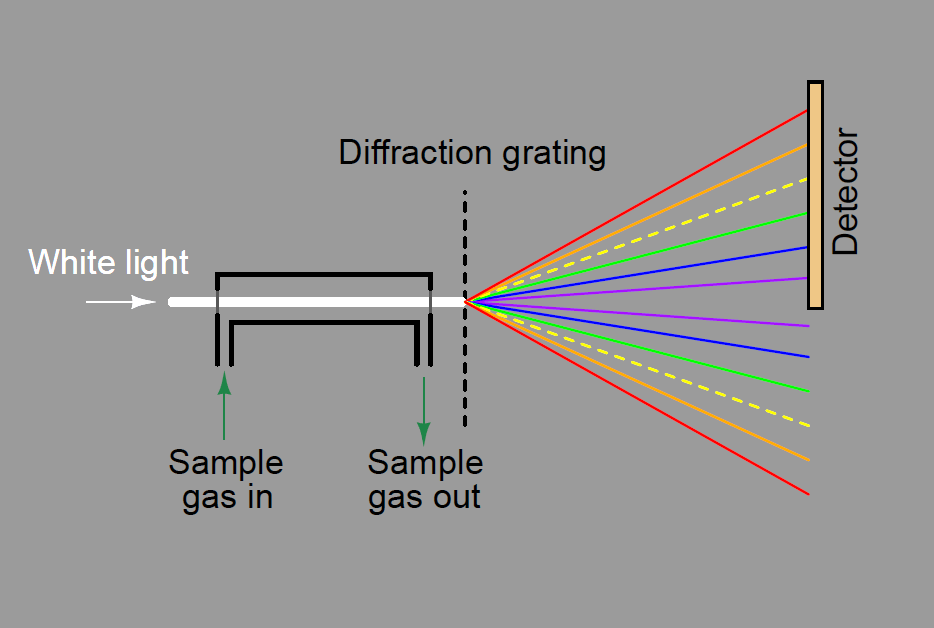
A dispersive analyzer for process fluids would be constructed in this manner, introducing incident light to a windowed sample chamber where some wavelengths of that light would be attenuated by interaction with the process fluid molecules. In this illustration, the sample gas absorbs some of the yellow light wavelengths, resulting in less yellow light reaching the detector array:

dispersive gas analyzer

The light source need not output white light if the wavelengths of interest do not span the entire visible spectrum. For example, if the absorption spectrum of a particular substance is known to primarily span infrared light and not the visible range, it may be sufficient to use a dispersive analyzer with an infrared light source rather than a “broad spectrum” light source covering both the infrared and visible ranges.

A necessary component of any dispersive analyzer is a computer connected to the detector array with the ability to recognize all expected emission spectra patterns, and quantify them based on the relative strengths of the detected wavelengths. This is a level of sophistication beyond most industrial measuring instruments at the time of this writing (2015), which is one reason dispersive analyzers are not as popular (yet!) for industrial process use. However, once such a computer and necessary software are in place to perform the analyses, measurement of multiple substances from the same absorption spectrum becomes possible. Like chromatographs, dispersive optical analyzers naturally function as multi-component measurement devices.

Don't Miss Our Updates
Be the first to get exclusive content straight to your email.
We promise not to spam you. You can unsubscribe at any time.
Invalid email address
You've successfully subscribed !

Continue Reading

pH Analyzer Calibration and Troubleshooting
Four Electrode Conductivity Probes Principle
Dissolved Oxygen Analyzer Interview Questions & Answers
Ionization chamber Principle
Oil in Water Analyzer Working Principle
Measurement of Carbon Dioxide in Flue Gas
Share This Article
Facebook Whatsapp Whatsapp LinkedIn Copy Link
Share
Leave a Comment

Leave a Reply Cancel reply

Your email address will not be published. Required fields are marked *

Stay Connected

128.3kFollowersLike
69.1kFollowersFollow
208kSubscribersSubscribe
38kFollowersFollow

Categories

Explore More

How to Calibrate Oxygen Analyzer? – O2 Sensor Testing Procedure
Basics of Chromatograph Operation
Moisture Calculator
How to Calibrate pH Electrode?
Basics of ORP Measurement
SWAS Analyzers Questions and Answers
Various Types of Sensors used in Water Treatment Plant
Working Principle of Gas chromatograph

Keep Learning

In-Situ Zirconia Oxygen Analyzer

Oxygen (O2) Measurement in Flue Gas

H2 S and Total Sulfur Using Lead Acetate Principle

H2S Measurement Using Lead Acetate Principle

pH Analyzers Interview Questions Answers

pH Analyzer Interview Questions and Answers

Oxygen Measurement using Tunable Diode Laser System

Tunable Diode Laser Analyzer Working Principle

ORP-sensor-calibration

Oxidation-Reduction Potential (ORP) Sensor Calibration Procedure

hygrometer for measuring moisture

Difference Between Absolute and Relative Humidity

Ozone analyzer principle

Ozone Analyzer Working Principle

Dew Point Method Humidity Measurement

Humidity Measurement Principle

Learn More

Control Valve Packing

Control Valve Packing

Difference between Availability, Reliability & SIL

Difference between Availability, Reliability & SIL

Process Pressure Measurement Objective Questions

Process Pressure Measurement Objective Questions

Conductivity Analyzer Principle

Conductivity Analyzers Interview Questions & Answers

Instrument System Architecture and Process Control Design

System Architecture and Process Control Systems Philosophy

Instrumentation Cyber Security

Instrumentation Cyber Security Glossary

Tap Changing Switch Animation

DCS ESD Logic Overview Graphic Display

Automation System Process Functionalities

Follow US
All rights reserved. Reproduction in whole or in part without written permission is prohibited.
Welcome Back!

Sign in to your account

Username or Email Address
Password

Lost your password?