We all know how important a single line diagram is. It is a basic representation of the whole electrical drawing in a panel. Due to this, any engineer can know how the power is flowing from the source to various loads. But it is also important to know that this diagram can help in SCADA design too. This is a very important feature for an engineer when he is designing electrical systems in SCADA. In this post, we will see how SLD can help in SCADA design.
What is a Single Line Diagram (SLD)?
First of all, let us understand what a single-line diagram is. A single-line diagram is an electrical drawing that shows how the power flows from source to load using single lines and symbols.
Instead of showing every physical cable present, it is a graphical representation in the simplest way, which gives a brief understanding of how all the cables will be laid. So it can also be termed as a map of the electrical system. In short, we get to know where power comes from, after that, where it is distributed, which devices are connected, and how all the devices are linked together electrically.
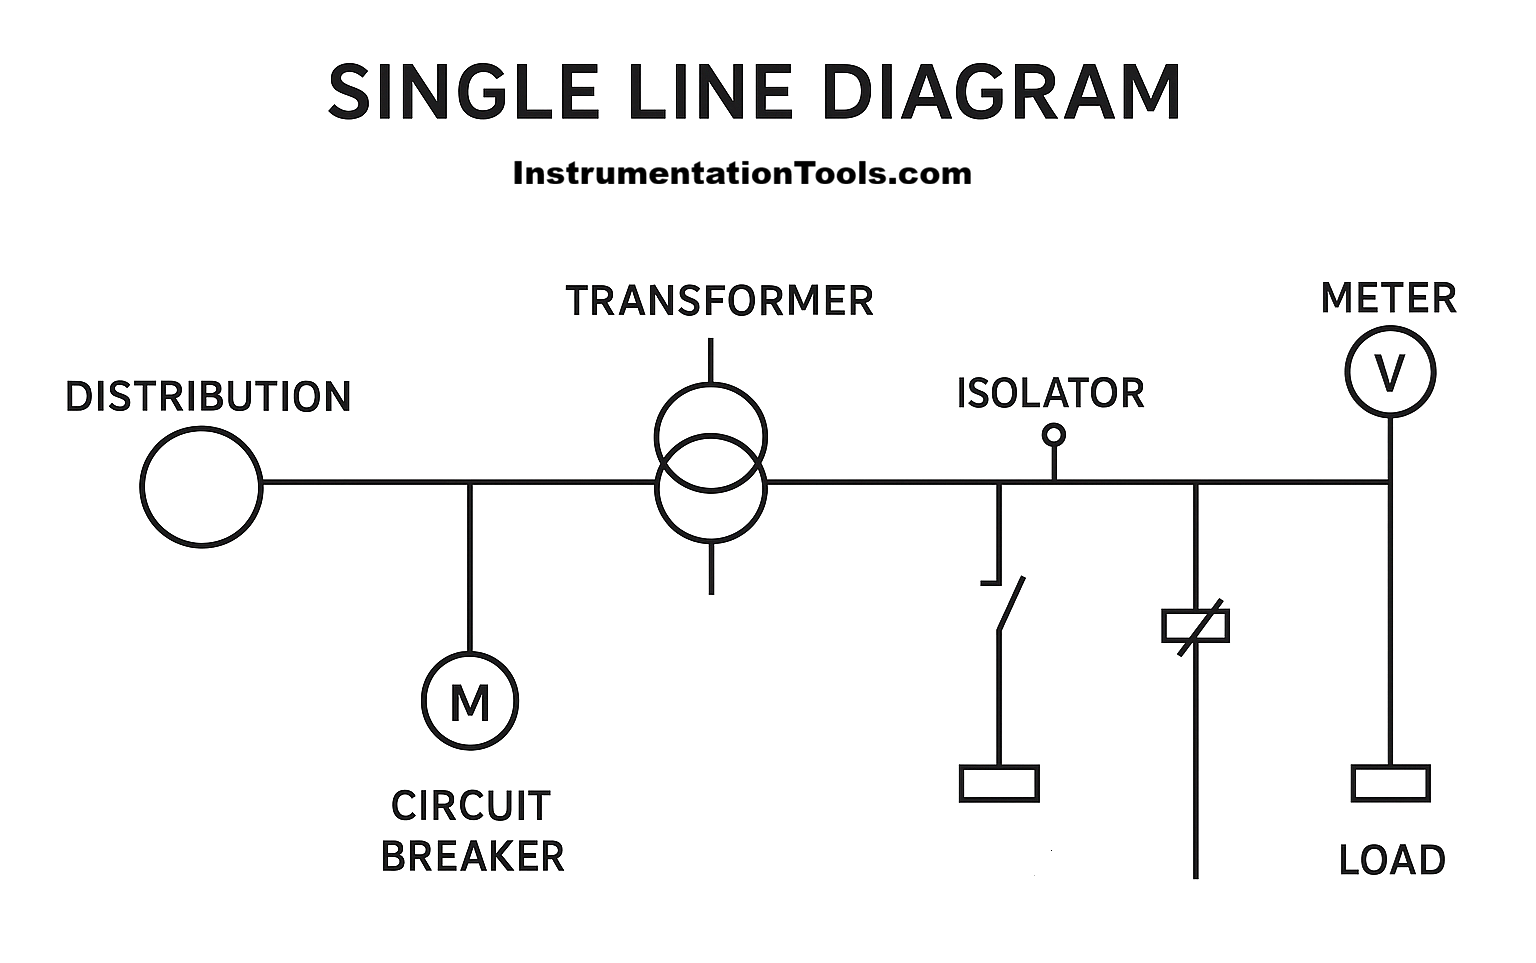
So, SLD will contain all the devices like transformers, busbars, circuit breakers, isolators, motors and loads, meters, and various types of relays. Refer to the image for a simple understanding. As you can see, there is a distribution point, followed by a circuit breaker, transformer, isolator, and a load monitored by a meter. Thus, it simply shows the flow of the circuit with lines and symbols.
Single Line Diagram in SCADA Design
In SCADA systems, when you are showing an electrical system, it is required to depict all the elements and their connections properly with the correct data. Due to this, you will know what status and indications to show, what the analog values are to be shown corresponding to a device, what the interlocks are to be shown with correct representation, and finally, what alarms need to be taken in the system corresponding to all the electrical data.
For this, one thing to note is that from the diagram, groups should be divided from incoming to outgoing. Due to this, you will get a clear idea of how many screens and popups are required to be shown in the program, also helping with proper navigation between them indirectly. Also, you should know whether a particular group of devices, like a meter, has the same data or not. This will help you create a face plate very easily.
As different types of devices have their corresponding alarms and their priority levels, this diagram helps to first identify how you can group them, or in short, which total devices need to be considered for your alarm grouping. And as today’s modern automation systems have energy dashboards on their cloud platforms and SCADA systems, gathering this data in a systematic way from the diagram has to be achieved very efficiently. Let us now understand simply how to convert an SLD into a SCADA design.
How to design SCADA from SLD?
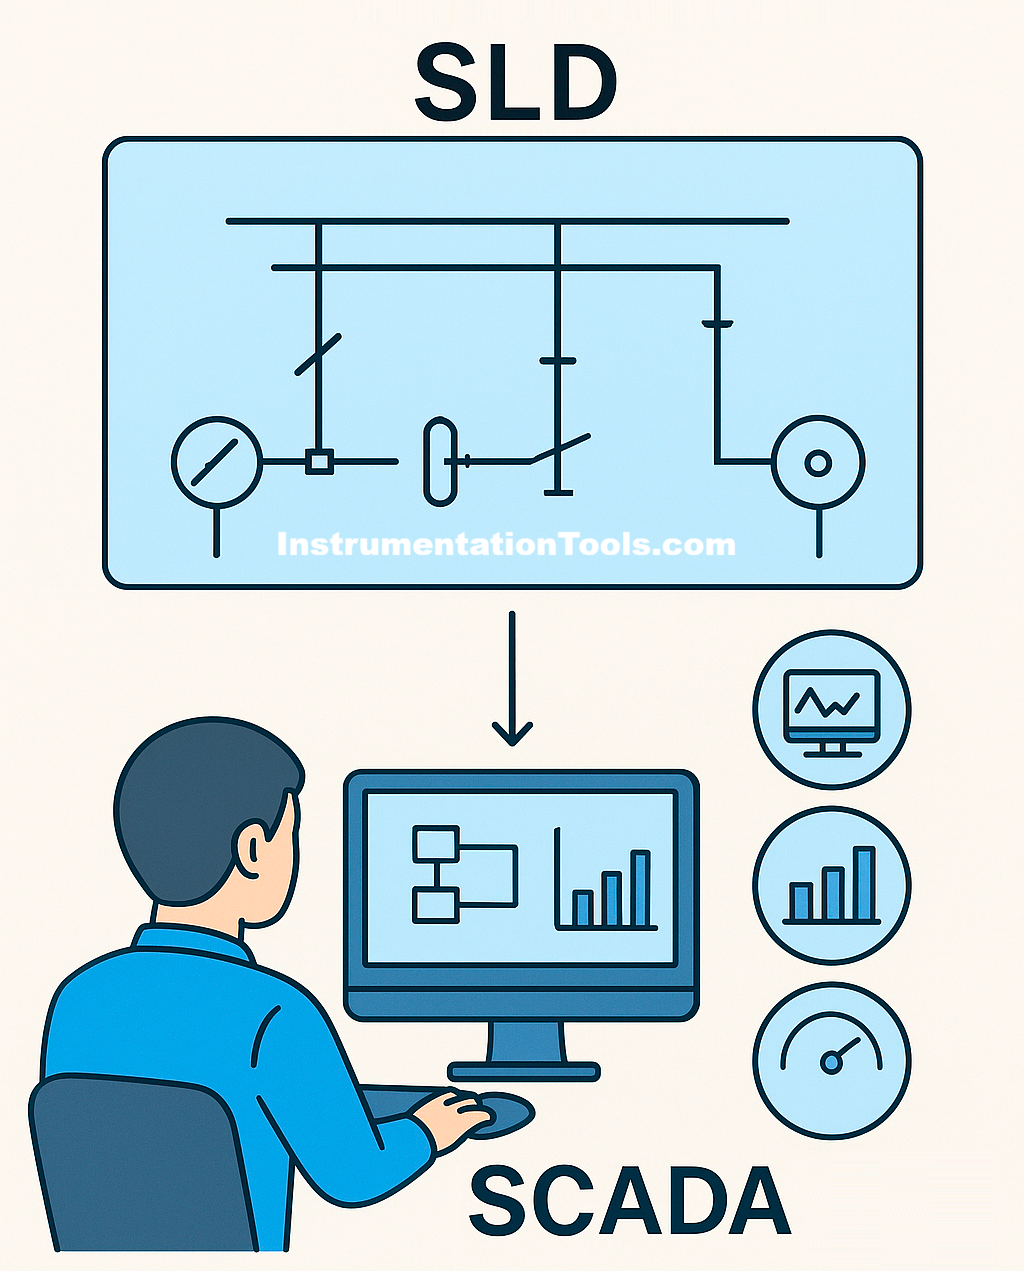
First of all, as discussed, you need to identify the main overview as well as its groups inside. For example, if we consider the image discussed above, let us take two such groups for our application. So, in our SCADA screen, we need to show two individual screens for two such circuits from the transformer to the load. Practically, the electrical flow starts from a main transformer to busbars to feeder panels and to the equipment inside them. So, we need to divide all these groups derived from SLD into various screens, making hierarchy and navigation structure.
Then, once you have identified the grouping of screens, you need to next identify which devices will give data and which device is a static representation just for representation. You would anyway get this communication data before engineering when you get the automation documents, but with SLD, you get to identify by seeing a visual diagram, which helps to program how many devices you can take in one single communication read-write group. Due to this, you get to know the amount of memory that will be consumed. Also, you get the list of all the objects that will have dynamic visualisation and consume runtime memory.
Then, if similar equipment has the same data, you need to design a faceplate for that. Apart from that, you then need to gather all the data of the equipment, digital or analogue, and decide how to show them on the main screen, and then inside the device details. With that, you get to know the actual number of SCADA tags that will be consumed.
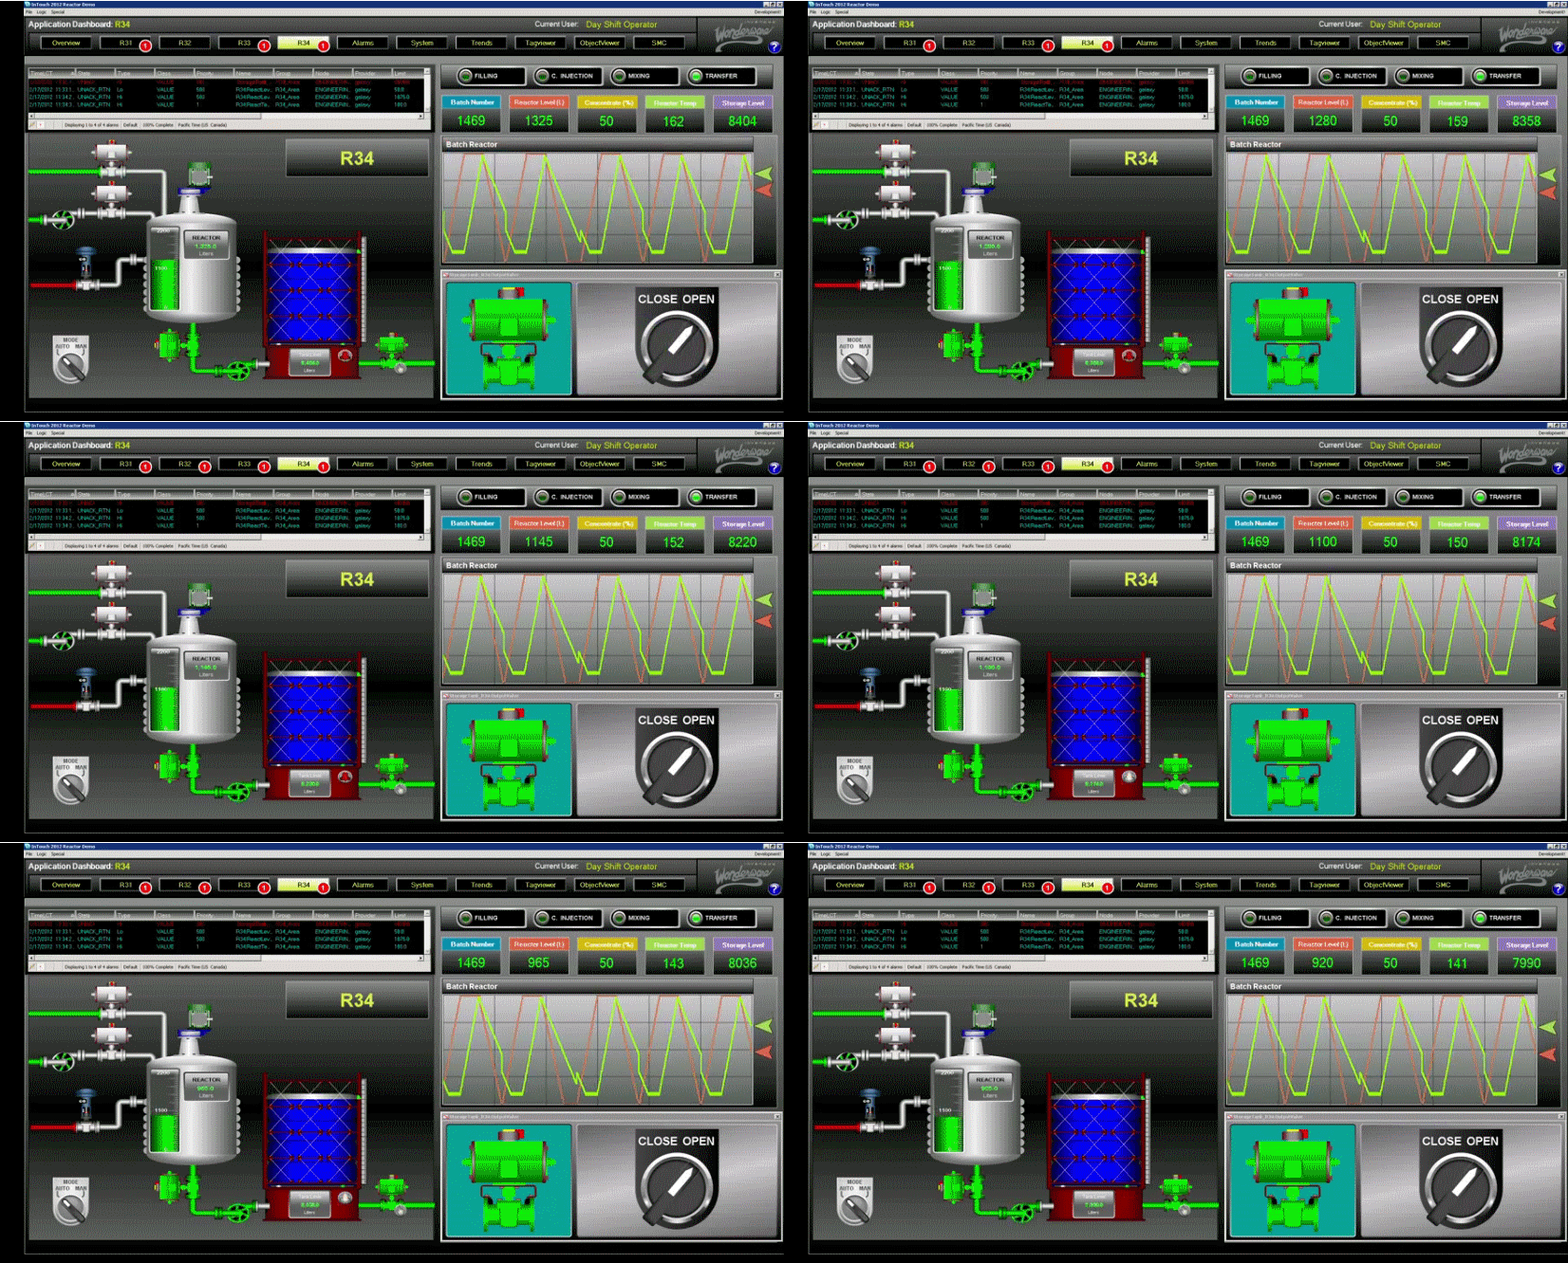
Then, similar to an SLD diagram, you need to use objects like a switch symbol, a two-coil symbol, lines, circles, motor icons, and squares that exactly resemble the drawing, thus copying the electrical system into your SCADA. Add standard automation colors to the objects and connections with live animations. After that, link all the screens together with a proper navigation architecture. At last, you have to create all trends, events, alarms, and reports for all this electrical data.
In short, SLD helps a SCADA programmer to exactly draw the electrical system in his program and define all the visuals and interlocks in it, so that any normal engineer can maintain and troubleshoot the system.